Week 1 Results

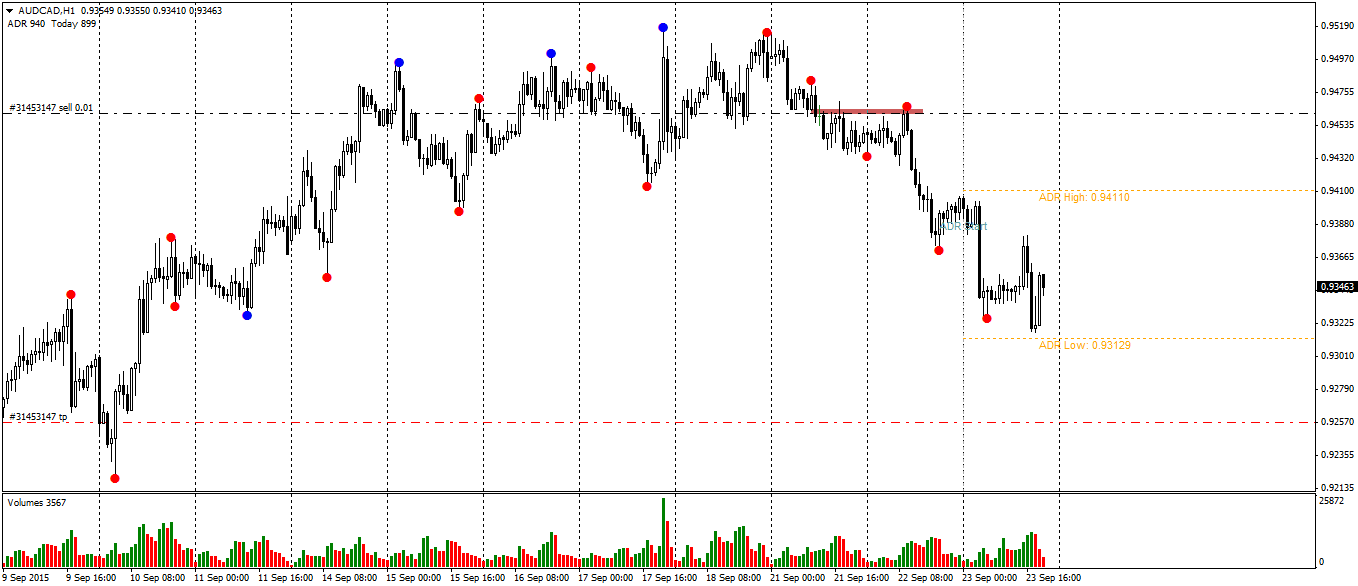
I am very happy with these weeks results and decided to exit my positions.

My reasons for exit were high volume bars with a narrow spread, signalling a lot of activity. This may result in a small term retracement to a recent negative order block on all 3 trades. I decided to take profits at these point and will watch again into next week to see if more Sell Set ups show up on these pairs.

One reason I am keeping my bullish USD stance is that the USD has been making a market maker buy model and has yet to complete.

Below is the chart.

usdxdaily

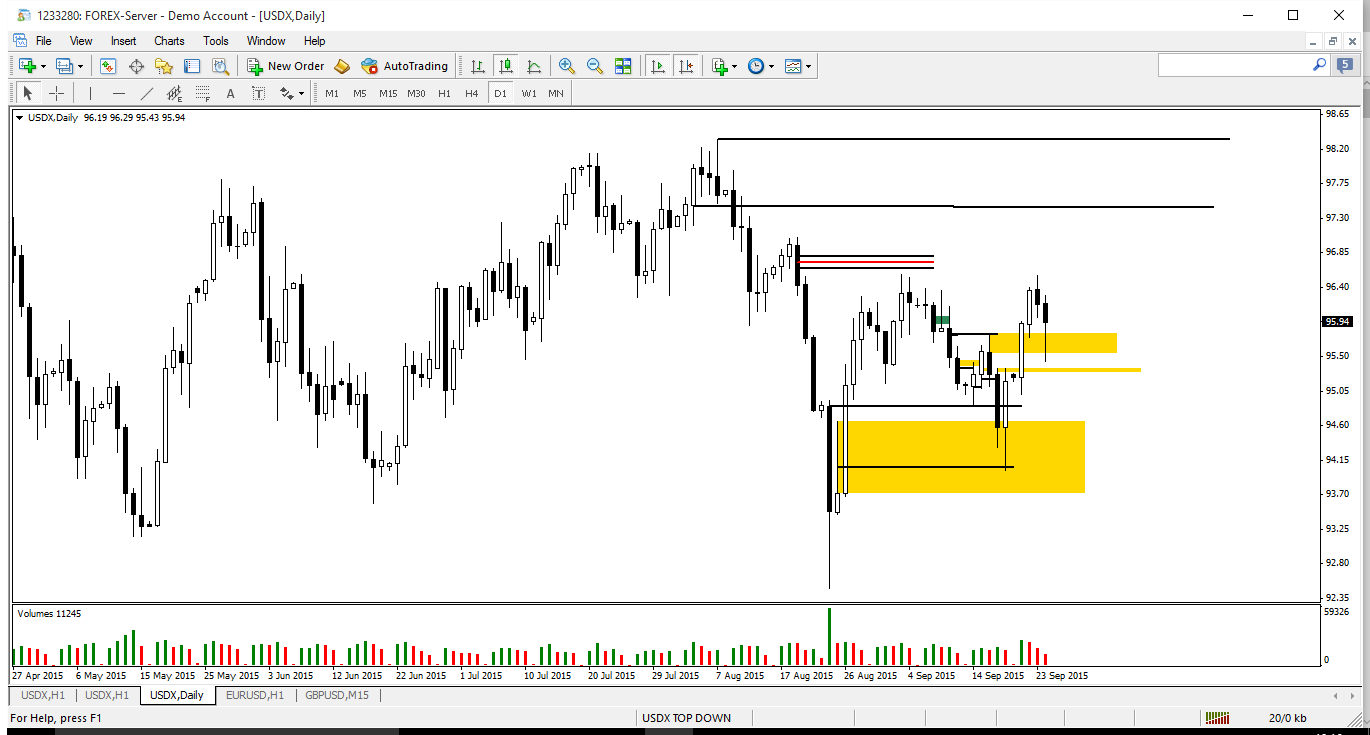
This shows a market maker model which I  have highlighted in a previous blog. Targets are for the USDX to reach 97.50 and then 98.30 potentially. The USD index shows the relative strength of the US Dollar and this is why I shall be keeping a bullish bias.

Reasons I closed trades

USDJPYH1 showing high volume

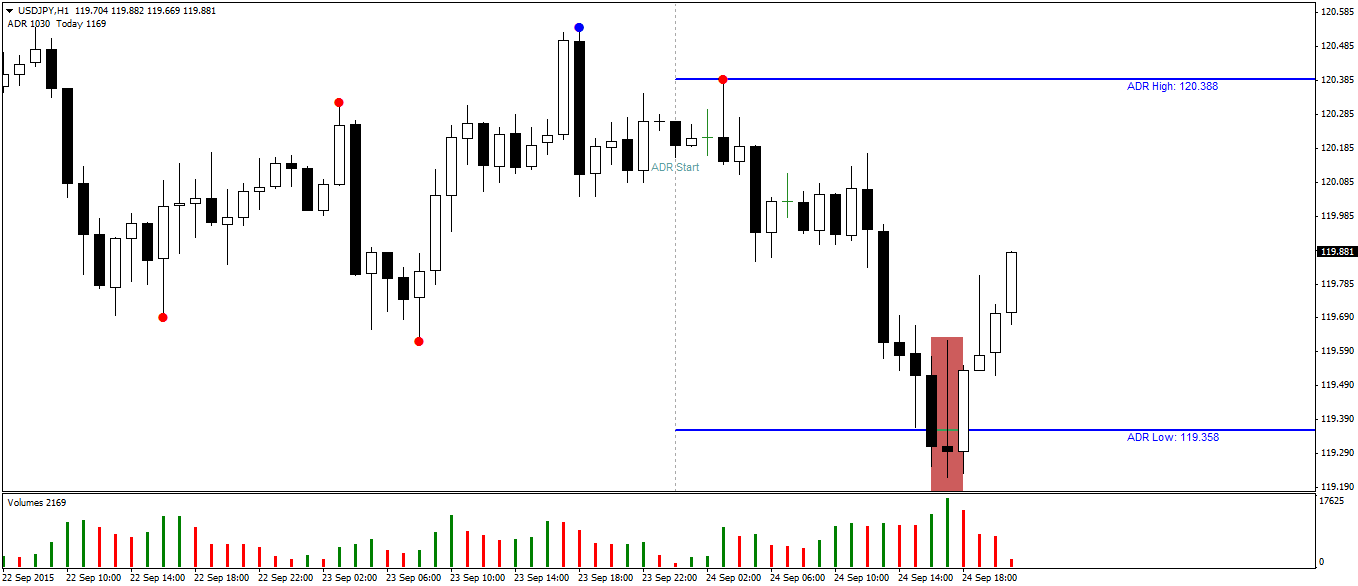
This is the reason why I closed Trades. As you can see a low spread candle formed with high wicks breaking the lows and the highs. This can also be known as a long legged doji. The volume was far greater than the previous bar. This much volume should have created a much larger down candle where we still bearish for the short term.

Instead this high volume indicated too us that something else was going on. The insiders were taking profit or buying up some of this pair. The falling volume on the 3-4 candles afterwards suggests that there is no interest to the upside yet and this is merely a retracement. Therefore I will be looking to re-enter the trade at the bearish order block we are approaching although this pair is ranging so I am slightly more catious so would like to see it hold first.

As you can see 3 hours after I entered the candle has quickly moved back to were I initially entered. This is why volume was a great warning sign to get out whilst profitable.

MYFXBOOK Results

Below are my fx book results for the week. I have taken 3 trades which were all profitable. My order sizes are very small and I have had to gain a fairly large 352 pips for 2.5% of my equity.

This is something I must work on. I should have been rewarded much greater in terms of percentage return for these trades. I must narrow my stop loss which means I can increase my order size whilst maintaining risk percentage. In doing this I should be able to double or triple and profits. The downsize to this is a greater chance of my stops being hit. This is a fine balance and the money management side of trading is the biggest factor in success or failure.

Below are my results:

myfxbook week 1

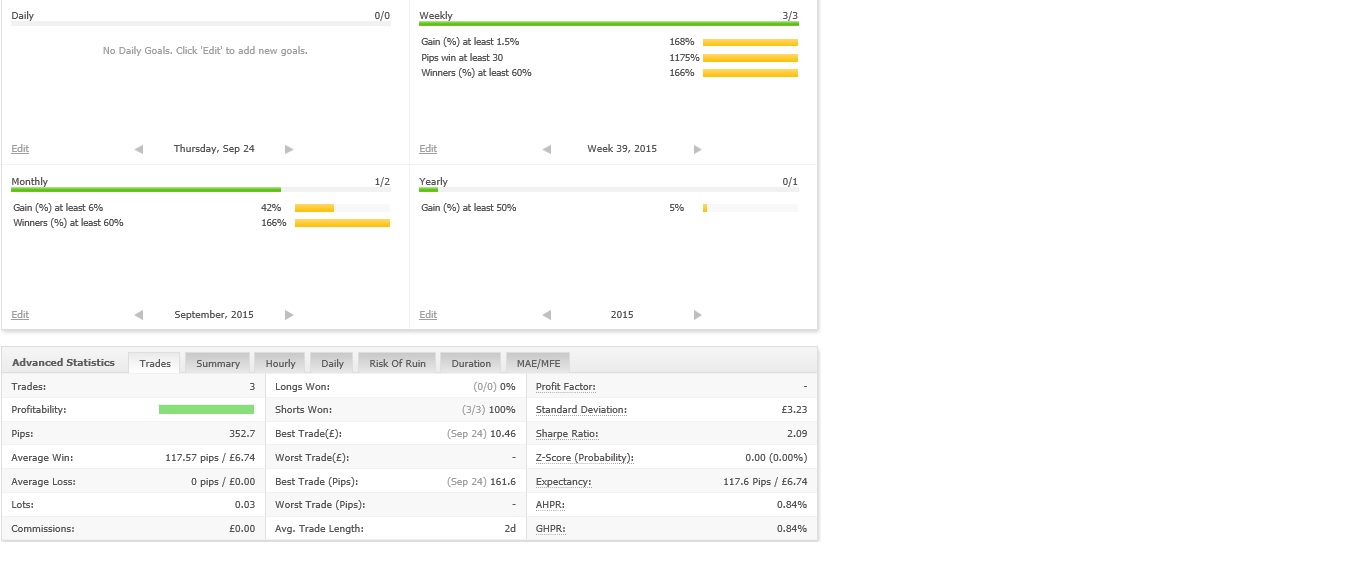
I am nearly 50% on the way to reaching my target of 6% a month in week one and very happy with these results. I am just concerned I have to find such big moves each week and that is why it is important to work on tighter stops and greater lot sizes. If I can do this I should find reaching my 6% target much easier with the potential to exceed. 6% a month will double my account every year and this would be a fantastic return.

This weeks orders

I am currently in 3 positions this week. However I missed my sell limit order entry for both the EURUSD and the GBPUSD this week for over 300 pips. One of the disadvantages of trading only on an evening is you do not know your order was not triggered till you return home from work to the charts. I should have looked at logical points to get in on the trade for the remaining part of the move but decided not to chase price.

My limit orders both missed by around 5 pips so in future I will try to lower my entry slightly rather than be right on the edge of the order block. At present I am trading with very small lot sizes and fairly large stops so 5 pips will not be critical in monetary terms.

The trades I did enter

Trade 1 – AUD/USD

AUDUSDH1 entry210915

I entered this trade on Monday. Reasons for entering were a reversal pattern on Friday. A climactic high volume candle and a break in market structure breaking the previous swing low. The pair has moved lower and is now making lower highs and lower lows.

I am aware of potential bullish order blocks and will be looking for any high volume candle signalling a reversal in these areas. If this does not occur my target is bellows of 0.695. I have now moved my trade to Break even. We would be expecting the low of the week to be made on Thursday so I will reassess this trade tomorrow.

Trade 2 – AUDCAD

I entered this trade on Tuesday. I saw a market maker sell model and marked a 1 hour bearish order block were price had moved from on Monday. The Tuesday Judas swing sent price up to this level almost to the pip and sent the trade straight into profit. I am very happy with the execution of this trade.

My aim is to perfect this type of with trend trade and increase position size/reduce stop loss and maintain risk% of 1%. This is hard at the present as I have to identify potential order blocks the night before. I hope within time to become much better at picking these areas and where to expect big price movements.

AUDCADH1entry210915

For this trade my target is slightly more conservative and at the bullish order block around 0.9265.

Again I will monitor this trade for reversal patterns. At present I am applying volume price analysis on higher time frames, namely the 4hour and daily charts simply as I only have an hour or so on an evening. This, at present, is keeping me in the correct direction of the higher trend.

I was a little disappointed this week to just miss entry on 3 trades which would have yielded 1-2% each in profits but I am happy that my analysis was correct in those trades and I would have been in profit, plus the two trades I am currently profitable in.

Week commencing 21/09/15

Since last posting I have used volume price analysis with success but added tools I have learn’t from the Inner Circle Trader, a former commodities trader I have been following on twitter. He uses a very successful approach and the degree of success for entries is somewhat staggering.

I have spent the last 6 months testing his strategies and how his tools are used on differing timeframes. Although the 15 minute time frames help set up trades for the day and have shown success I feel that I am more suited to the larger timeframes. This is due to other commitments to be analysing the market every morning at London and New York open.

I am therefore going to apply his tools which I have hugely benefitted from along with volume price analysis to confirm/negate an entry.

Order Blocks

I will be using ICT’s order blocks to help me find areas to enter a trend. This helps me get in at good points. The idea is that when a large move has happened, the people behind it are the smart money. When price returns to this point the smart money will be interested in this price area again. ICT uses the top of the wick to the top of the body of the bearish candle before the upmove to identify where most of the buying has taken place.

I have added a chart here which shows the EUR USD with the wicks of the down candles before the upmove highlighted so you can see the reaction as price reaches.

EURUSDDaily order blocks

Here you can see how instead of chasing a move you can be patient and wait till price returns to this area.

Another way in which I will be looking for entries is to use volume price analysis. Here I analyse candles, body size and wick size in comparison to volume. This is then compared to candles around them and we zoom out and analyse the big picture.

An example would be that if we see a large up candle with large volume then this is a valid move. A large up candle with low volume would be suspicious and a potential trap move or stop run.

In an uptrend we would hope to see increasing volume and price rises and decreasing volume on retracements to show a lack of selling interest.

Here is a chart I have recently analysed:

EURUSDH4vpa

It may look a little complex but it is really worth the time understanding as is the work of the InnerCircle Trader. This analysis comes from Anna Coullings Volume Price Analysis book which is probably the best £15 I have ever spent.

I will be using a host of other tools from the Inner Circle trader who uses smart money divergence, the USDX to great use, his market maker model, along with a way of thinking like the smart money.  An understanding of why price is going whrere it is and for what reason.Where are the stops? Where is the liquidity.

He has been a great insight and a great help.

I am going to use this blog to document my trades and reasons behind it, simply as I feel I analyse better when I know people may be judging my decisions. I am sticking to the higher time frames, mainly 4 hour and daily with the odd 1 hour trade. This is again because I feel I am less likely to become emotional and trading decisions are more logical and with the long term bias.

Below is an example of a market maker model. This is a buy model where price starts and pauses in consolidation several times before smart money reversal. We then have a safe buy area and our target should be each stage of the down move. As you can see the model completes by reaching for the initial price and then the stops which are placed above it. The fact it dipped straight back in the range suggests that this was a run for liquidity and we could now see the pair go lower again.

USDJPYMonthly

This model is seen throughout the charts on all time frames and I think it is always important to know what stage of the model we are at and what type of move we are expecting. For example, after the smart money reversal where the lower highs and lower lows are broken we would change our outlook to the upside.

We can then use order blocks for entry on daily 4 hour, 1 hour or even 15 minute charts.