I have always been a swing trader, always trading forex and always with fairly simple candlestick charts and volume. Changing circumstances however have allowed me more time to be at home during the day and I have been teaching myself how to use the tools on offers in the futures market. I’ve started small, trading the micro’s whilst I work out a plan. Trade time will be much smaller. I don’t plan to scalp, but hole something from 30 minutes to a few hours.
I opened an account with amp futures and are using Quantower which is free. Features include footprint charts, volume profiles, TPO charts etc.
I have been looking at a great site called trading riot which offers many free articles on how to use these tools. I also invested in his trading blueprint and have taken from it some interesting parts to add.
I have always traded the swing failure pattern (liquidity raid) myself and that is something I have found ( through tradingriot) can be traded better using the tools named.
In a future post I will cover more about the tools and how I trade with them as I go. Today was my first day trading. I only took one trade and it was at 8pm uk time (lots of note taking).
Here is the initial setup

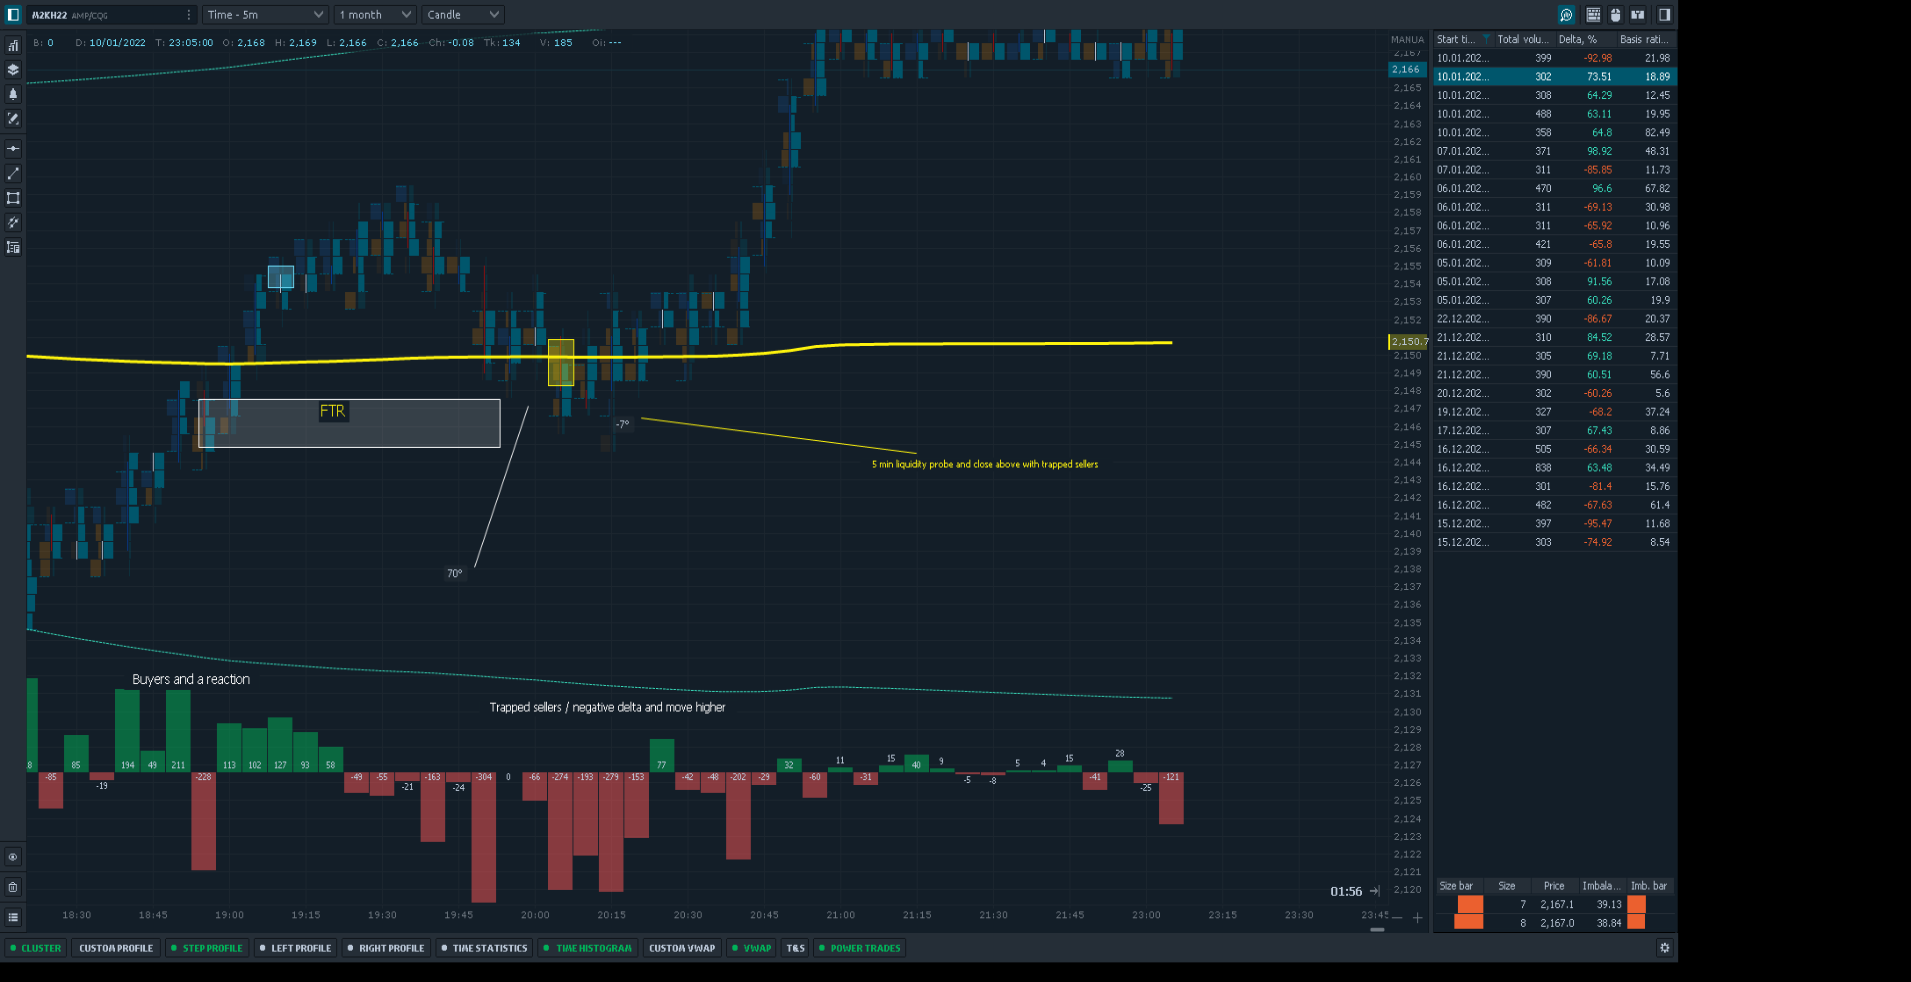
I continued to watch price and the last yellow box (labelled -92% delta) showed a lot of sellers entering the market. Despite this price moved higher, indicating trapped sellers. The bar is also bullish but with a negative delta. I am nowhere near an expert in this field, but the sellers within this candle had no effect.
I went to a five minute chart to look for an entry.

I placed my entry with stop below the lows. My target is highlighted on chart one. I chose that areas as there was some equal highs as well as large selling in that area on the delta profile to the left.
Below is a chart showing delta (left) and volume (right). This shows the negative delta on those bars but also sellers trapped, both from the power trades bar( yellow box), but also at the very lows of the liquidity run lower which formed my entry candle.
Enjoying learning a new concept and liking the fact I could get in and out of a trade and make as much in 40 minutes as I would normally by holding something days to weeks. Shall add more as I learn more.