The Move to futures

I have always been a swing trader, always trading forex and always with fairly simple candlestick charts and volume. Changing circumstances however have allowed me more time to be at home during the day and I have been teaching myself how to use the tools on offers in the futures market. I’ve started small, trading the micro’s whilst I work out a plan. Trade time will be much smaller. I don’t plan to scalp, but hole something from 30 minutes to a few hours.

I opened an account with amp futures and are using Quantower which is free. Features include footprint charts, volume profiles, TPO charts etc.

I have been looking at a great site called trading riot which offers many free articles on how to use these tools. I also invested in his trading blueprint and have taken from it some interesting parts to add.

I have always traded the swing failure pattern (liquidity raid) myself and that is something I have found ( through tradingriot) can be traded better using the tools named.

In a future post I will cover more about the tools and how I trade with them as I go. Today was my first day trading. I only took one trade and it was at 8pm uk time (lots of note taking).

Here is the initial setup

Using a tool called power trades ( small yellow boxes) it highlighted two areas where there was large buying and a 64% positive delta (more buyers) . The reaction to this was genuine and price moved higher. Also at these lows was a liquidity raid (red candle takes the lows yet closes back within range)

I continued to watch price and the last yellow box (labelled -92% delta) showed a lot of sellers entering the market. Despite this price moved higher, indicating trapped sellers. The bar is also bullish but with a negative delta. I am nowhere near an expert in this field, but the sellers within this candle had no effect.

I went to a five minute chart to look for an entry.

Here it is. What we can see is price breaking out of the highs on the left. Then there was a nice amount of space before it came to retest the area. As it returned we see the red candle (arrow to it in white) showing the -95% delta. 2 bars later we see a blue bullish candle which closes above, trapping those sellers. We are also at the Point of control, VWAP and a resistance turned support level. The red candle highlighted with a white box is where I was looking for a buy. This red candle also has some trapped sellers who would exit (and therefore buy back) in this area.

I placed my entry with stop below the lows. My target is highlighted on chart one. I chose that areas as there was some equal highs as well as large selling in that area on the delta profile to the left.

Below is a chart showing delta (left) and volume (right). This shows the negative delta on those bars but also sellers trapped, both from the power trades bar( yellow box), but also at the very lows of the liquidity run lower which formed my entry candle.

Enjoying learning a new concept and liking the fact I could get in and out of a trade and make as much in 40 minutes as I would normally by holding something days to weeks. Shall add more as I learn more.

A Trade from this week using volume price analysis

As you may know, I use a series of differing concepts in my trading. Volume price analysis always made sense to me since I bought Anna Coullings book 5 or so years ago.

Around the same time I stumbled upon Inner circle trader and took on board some of his concepts, mainly hunting for liquidity, amongst other concepts.

Along with these traders I have also been inspired by Tom Dante (break and retest and swing failure patterns) .

A lot of these concepts overlay each other and are very similar in nature.

I put these together and my general approach uses volume profile, volume price analysis, along with basic support and resistance and technical analysis. Liquidity raids (or turtle soups) add an extra confluence .

Here is a trade that I took on Monday.

The Volume profile marked here was marked to cover the large move down, as well as the consolidation area before it as well as the move up . The reason I covered such a large area was that I was interested in the V shaped potential bounce from the trendline marked in blue. My initial plan was a buy with the trend . However, as I watched price unfold I seen that most of the volume continued to be higher up. This gave a big clue that the major players were selling. As price came back to this area.

Another huge indication that we would be having some sort of a move lower were the candles on the way back up to the point of control.

I have labelled a chart below. At point 1 we seen a large up candle on average volume. This was then followed by a much smaller up candle with rejection at the highs ( from the point of control) as well as an increase in volume. An increase in volume would have created an even bigger up bar if this volume was buying.

This indicator, coupled with the point of control being at the highs and very little visible selling around the trendline was what gave me the confidence in this setup. My target was fairly conservative, at the next node of higher volume as indicated on the chart.

I have also added a one hour chart showing how there was a very similar pattern emerging on this timeframe. We see a fast move down and the most volume from that move down being shows at the high. As price then retests the area we see rejection from the point of control.

Analysis May 2021

I have not spent much time anaylsing and trading recently due to house move. Beginning to get back into things in May and here is my analysis.

I became inconsistent with my trading and following my plan recently ( probably due to the lack of time). I have created a flow chart which I will be using to get me back on track. Sometimes I need a rigid framework to get back in sync with the markets. I also use Edgewonk trading journal and that has shown a lot of trades which do not follow my plan.

Here is a link to my flow chart. It may look confusing but it makes sense to me and that is all that matters!.

https://miro.com/app/board/o9J_lHP__Xk=/

AUD/CHF – Daily

Will be looking for a break and retest at the arrow. Price has broken the uptrend and I am already in a short position from 0.715. This trade was taken as the uptrend was broken ( trend reversal). We then also had a break and retest of a key level as well as confluence with the down trendline. It is worth noting that as of yet the down trend line does not have as much strength as the uptrend that came before it and therefore may only be more of a corrective phase before another move to retest the highs.

AUD/JPY – Daily

We have also broken an uptrend on AUD/JPY and an opportunity to short has appeared (my entry). However, price has yet to close through the key level that I had marked. This key level is also a confluence with volume profile for this period, which also happens to show the most volume traded at the same level. A close below would be a good indicator and would be my trigger to sell with a target below the last 4 lows where no liquidity has been taken at any point.

EUR/USD

Below Key level and with counter trend line. The high near arrow is also the volume point of control of the area to the left. This shows there was selling near the solid white horizontal line and sellers appear to be adding more here.

GBP/CHF

I am already in this trade short from the first arrow. The first trade was simply a break of trend line (trend reversal) as well as a break of key level (push lower). Both of these where then retested at the same point (confluence) along with a valid entry pattern.

Shall try to add more as the month progresses and document a few trades I have made, winners and losers.

Analysis August 2020

I have decided to start writing my blog again as I feel it helps my thought process and question my trading in a good way. When we are sharing things, we check it makes sense and for me it further enhances my understanding of what I do and do not know.

Without this process I find myself almost trading on autopilot and not really checking how setups relate to my plan. So I will continue to blog to aid with my own development and if it helps others, great.

I now try to trade with Monthly and Weekly larger moves, and look for setups within this on the daily time frame.

I tend to take setups at Key support and resistance levels with confluences from trend lines, liquidity hunts (stop runs) and occasionally a moving average.

The two setups I will be trading are Bearish/Bullish engulfing candles and a 3 candle setup, which involves lower lows for sells and higher highs for buys.

Engulfing

Bearish Engulfing

Key Features of an Engulfing bar ( for me)

  • Body of candle 2 closes below open of candle 1 for sell
  • Body of candle 2 closes above open of candle 1 for buy
  • Price is at a Key level

Other confluences which can aid:

  • Liquidity has been taken
  • With Trend
  • At a Trend line for confluence
  • Volume of candle 2 is higher showing more activity and a strong response.

I then mark the body of candle 1 with a fibonacci and mark 50% of the candle. I find that on successful trades, often price comes back to this level before rejecting further.

I am in the process of collecting stats on a 50% entry as a limit order compared to just trading after candle 2.

There are several options however –

  • Entry after candle 2 formed.
  • Limit order at 50%
  • Watch 50% and wait for further rejection at this level

Of course you may miss many setups by waiting on 50%. However, the Risk reward ratio is much better, and quality of trades is better than quality.

I have added an image showing a confluence of factors which personally gives me more reasons to enter a trade.

Rather than just trading a specific pattern, I try to look for a series of reasons and confluences. 

Getting out of a trade is always the trickiest part in my opinion. The next Key level of trouble area has a higher chance of success, but I like to try and stay in when a trend is on my side until it is broken.

This is more often than not easier said than done and one part of my trading I am working to improve.

Observations of the ICT breaker

My own analysis of The Inner Circle Traders work to help improve my trading.

The breaker is a concept taught by ICT. After my own analysis this is my break down of a recent trade and a series of events that occur leading up to the trade and when it is right to enter. This is only initial observations and may prove to be incorrect after longer analysis. I am also explaining why I think what happens at each stage does. I find if there is a logical reason for something happening then you believe and ultimately trust in it more. Also, the more confluences the better.


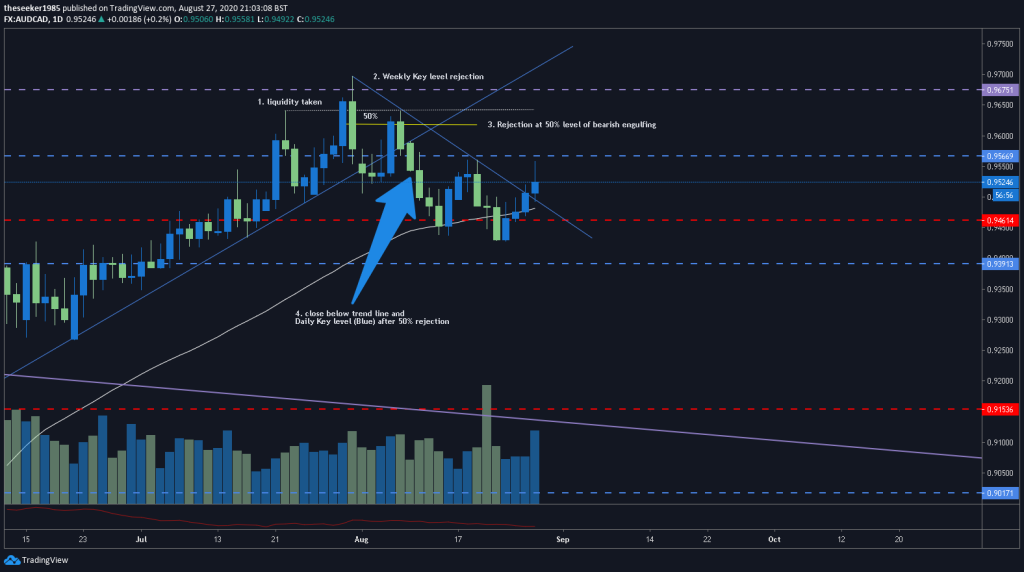
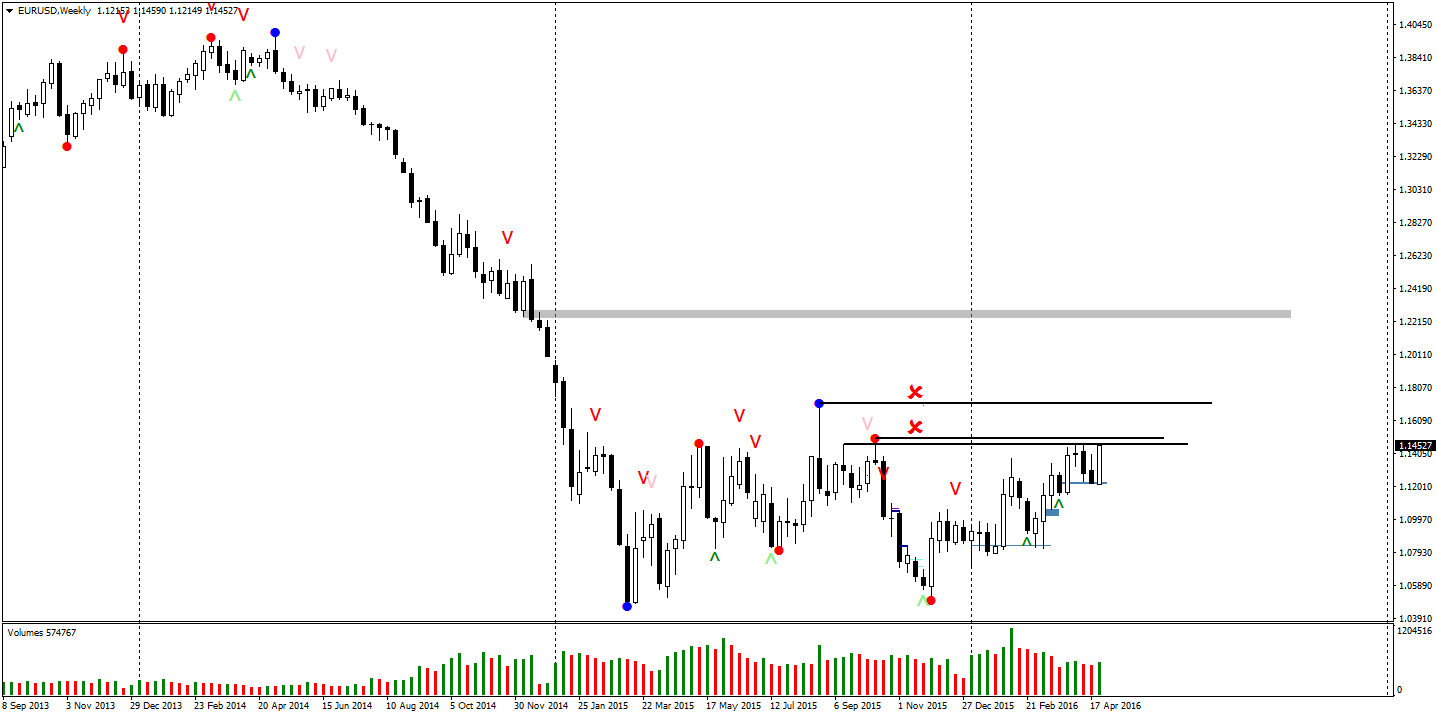
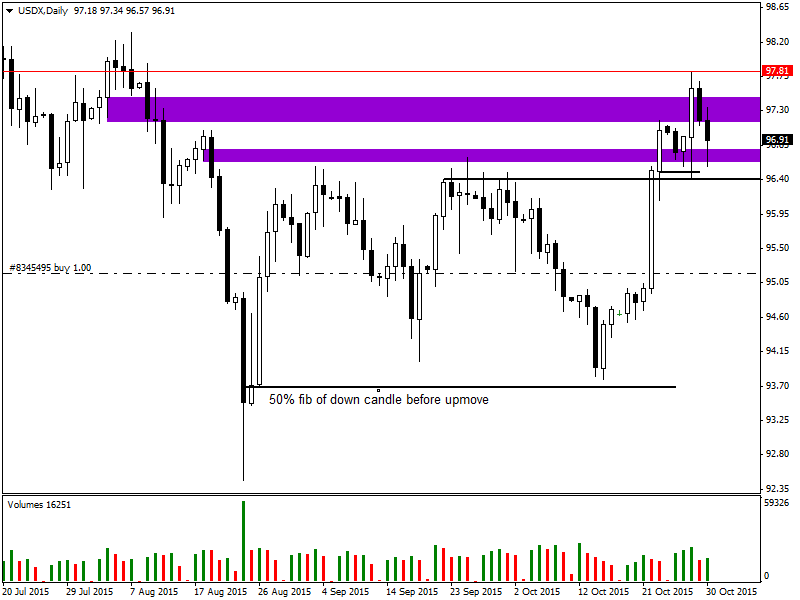
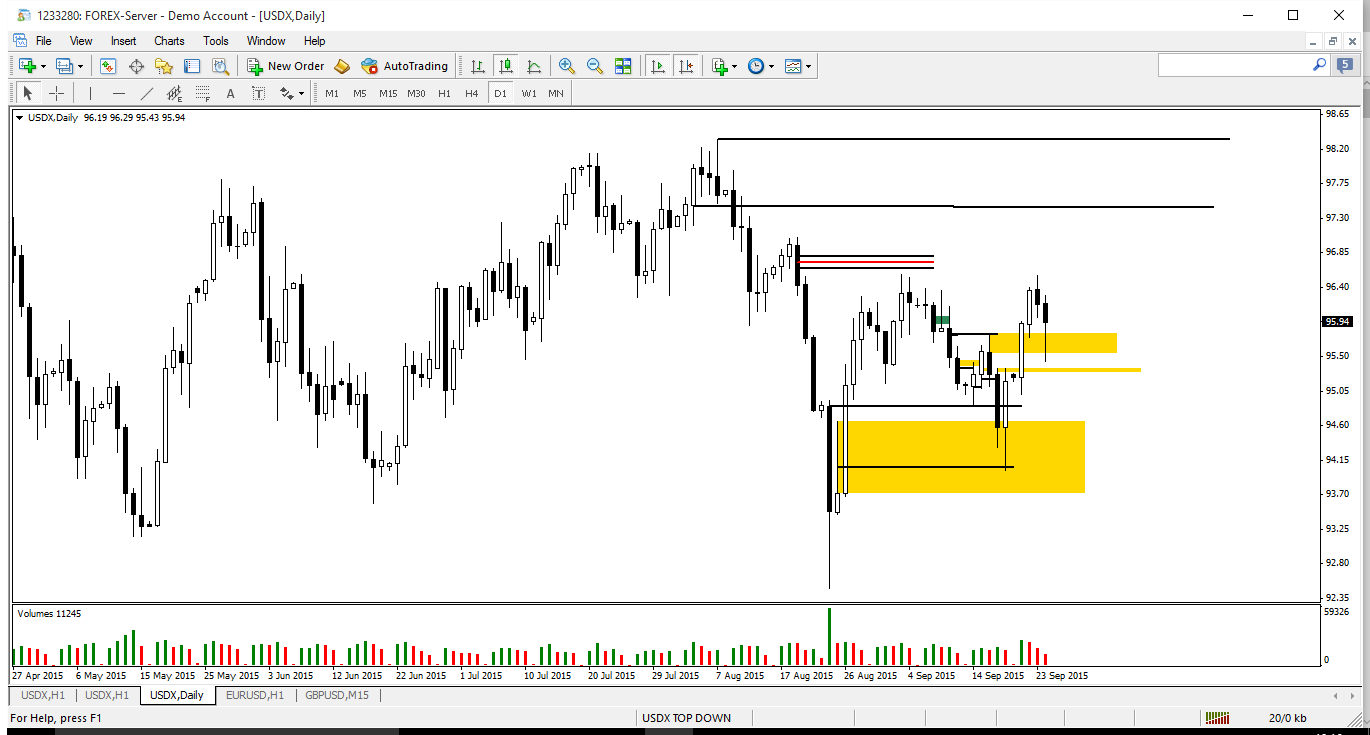
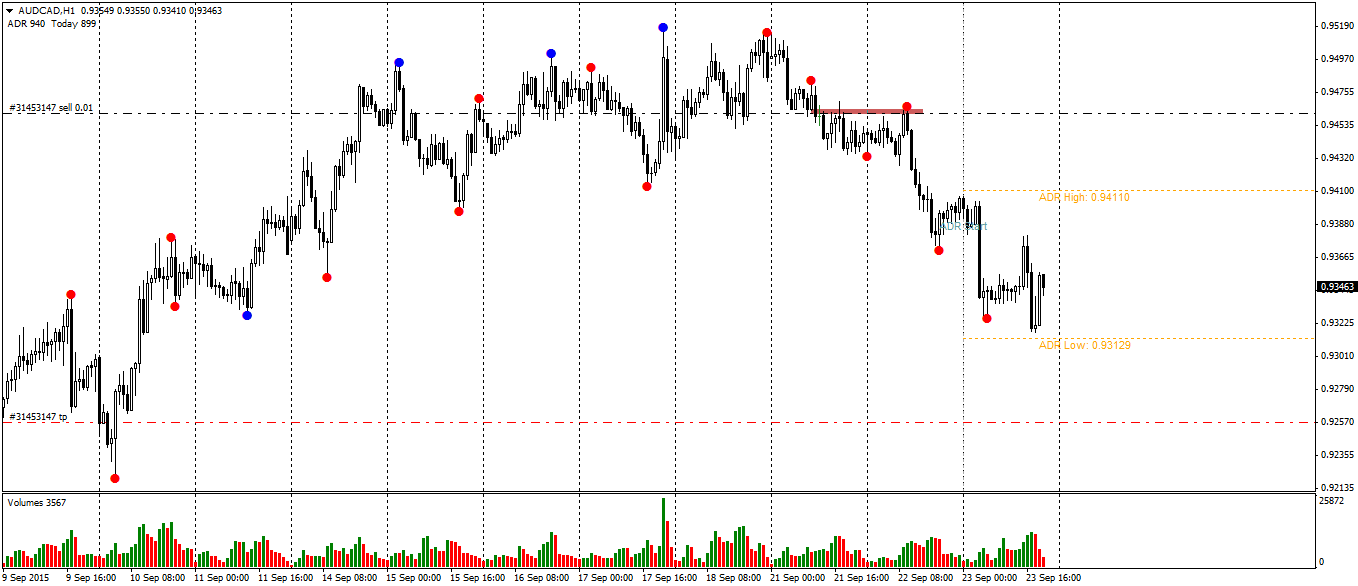
I will be looking at the USD/CAD from last week.

Picture1

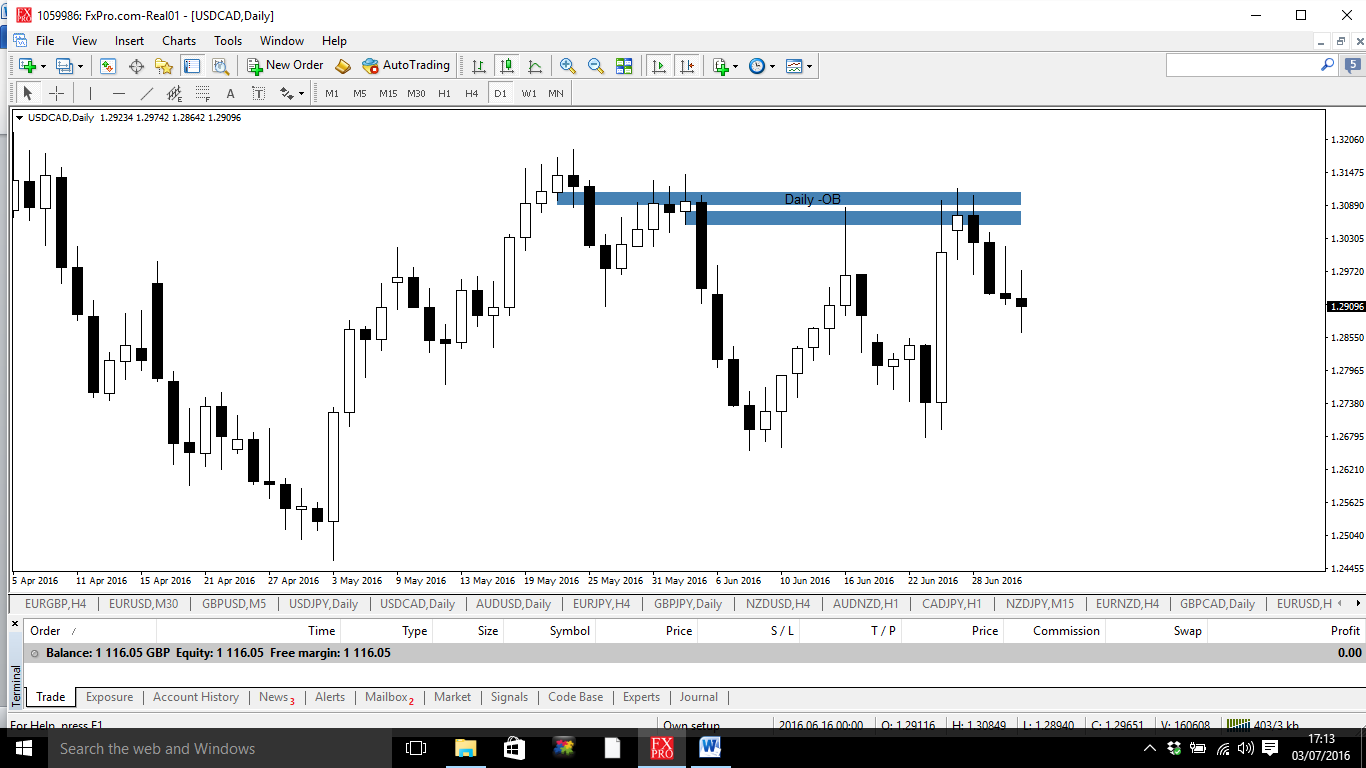
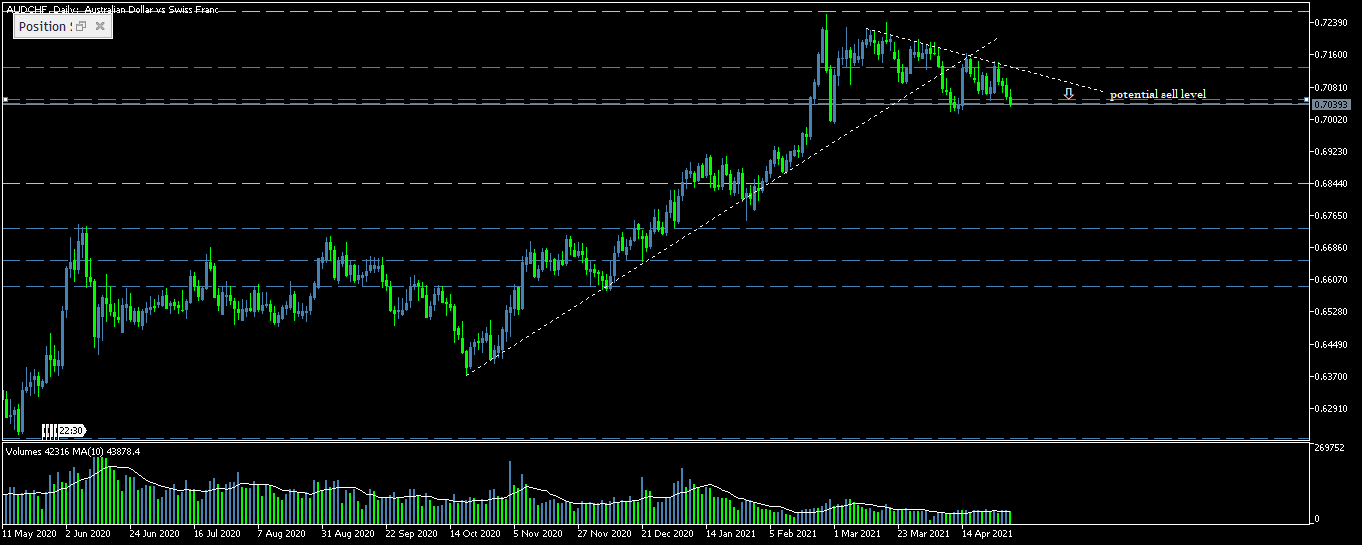
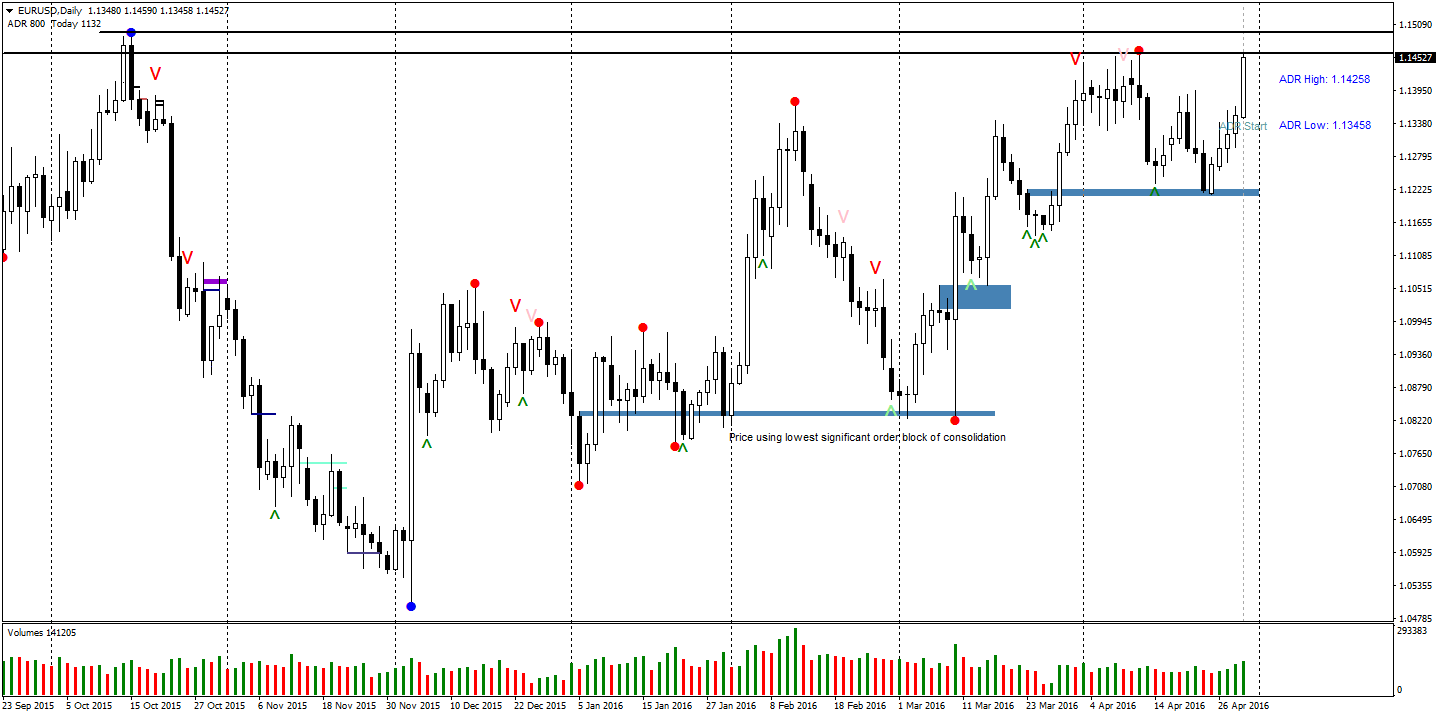
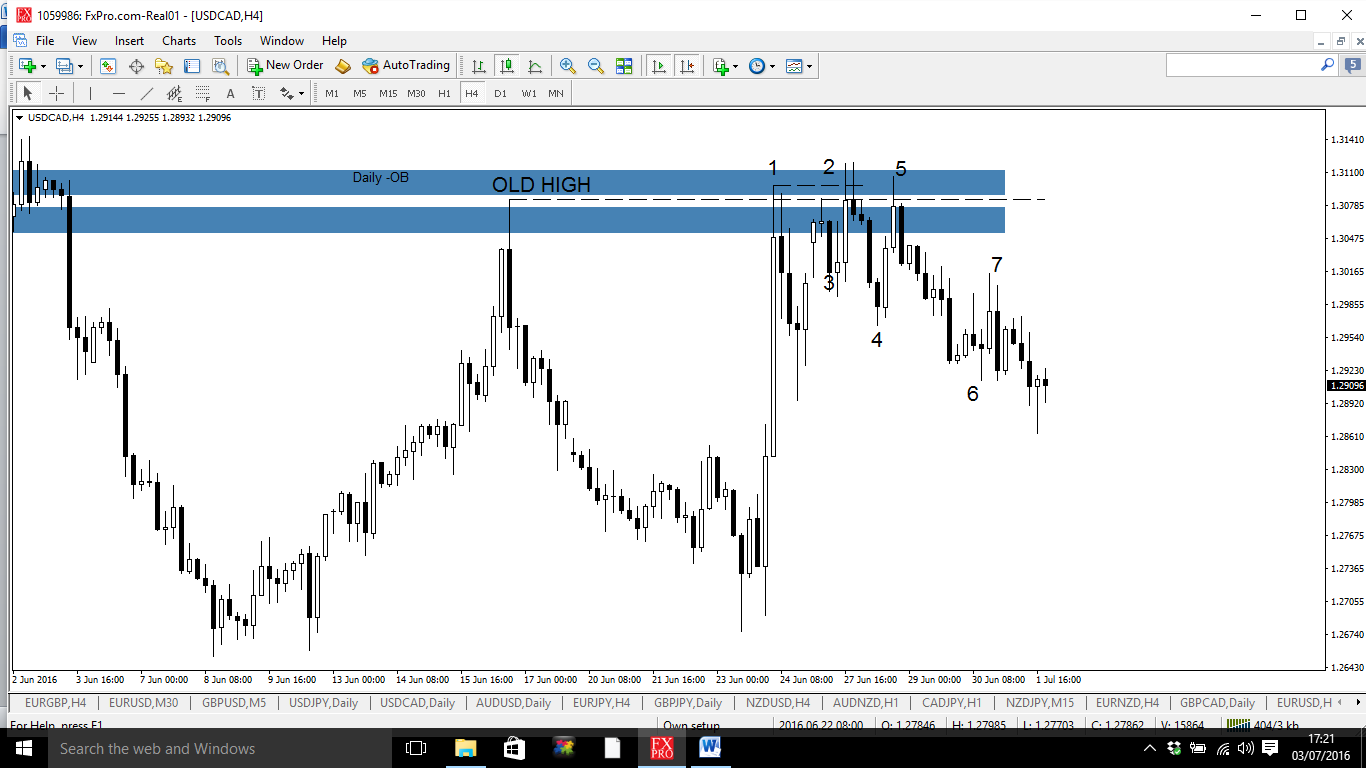
Price was running up into two bearish daily order blocks so the expectation was for some reaction within this area.

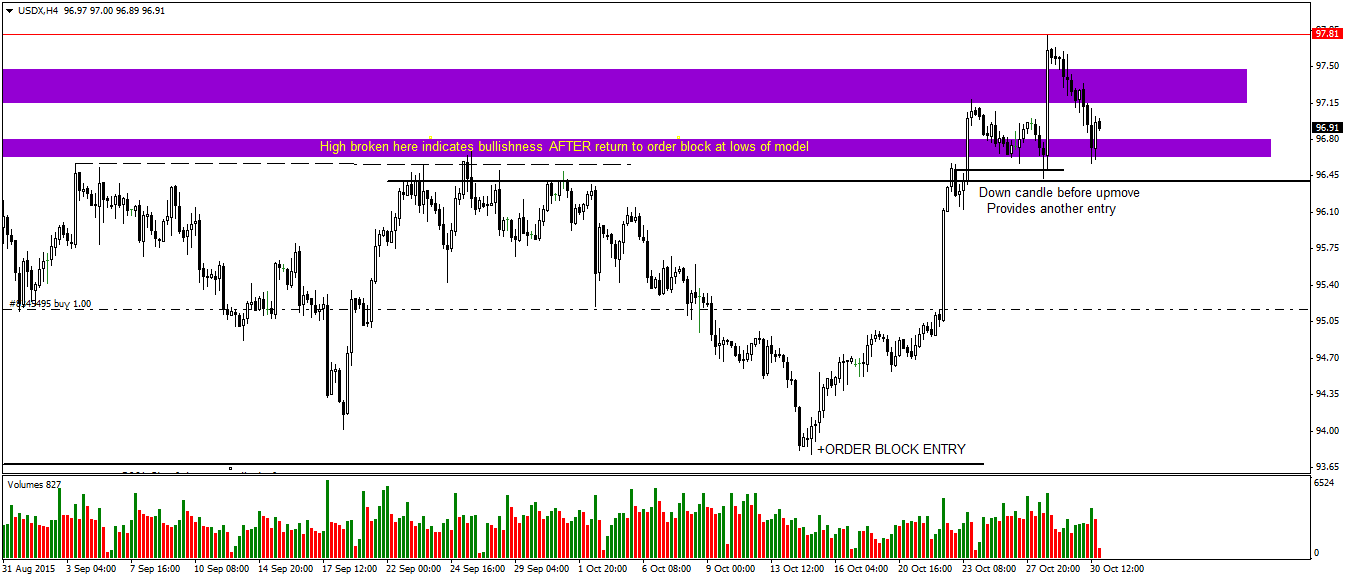
Below is a 1 hour chart. I have found there is 4-5 different things I feel like I need to see for this to be a valid trade.


OLD HIGH –

A break above an old high and into an area such as a recent order block. ICT always says “Beyond stops into Order Blocks” is one of the highest probability trades you can take. In this case it was above an old high and into two old bearish order blocks so this is an area we should be watching for a smart money reversal. Below is showing that high.

Picture 2

Once this has occurred I like to then view this area in 1 hr format or when we get down to the fine tuning a 15 minute chart.


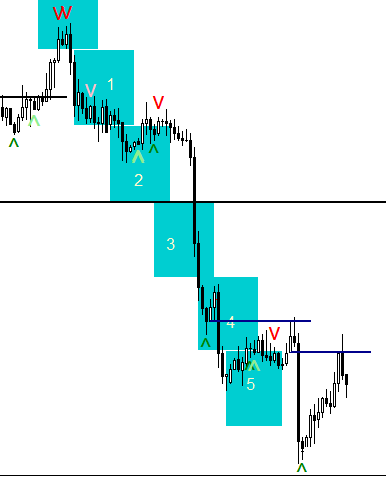
Below is our one hour chart and I have numbered all that I seem to be seeing with this breaker pattern time and time again.

Picture 3

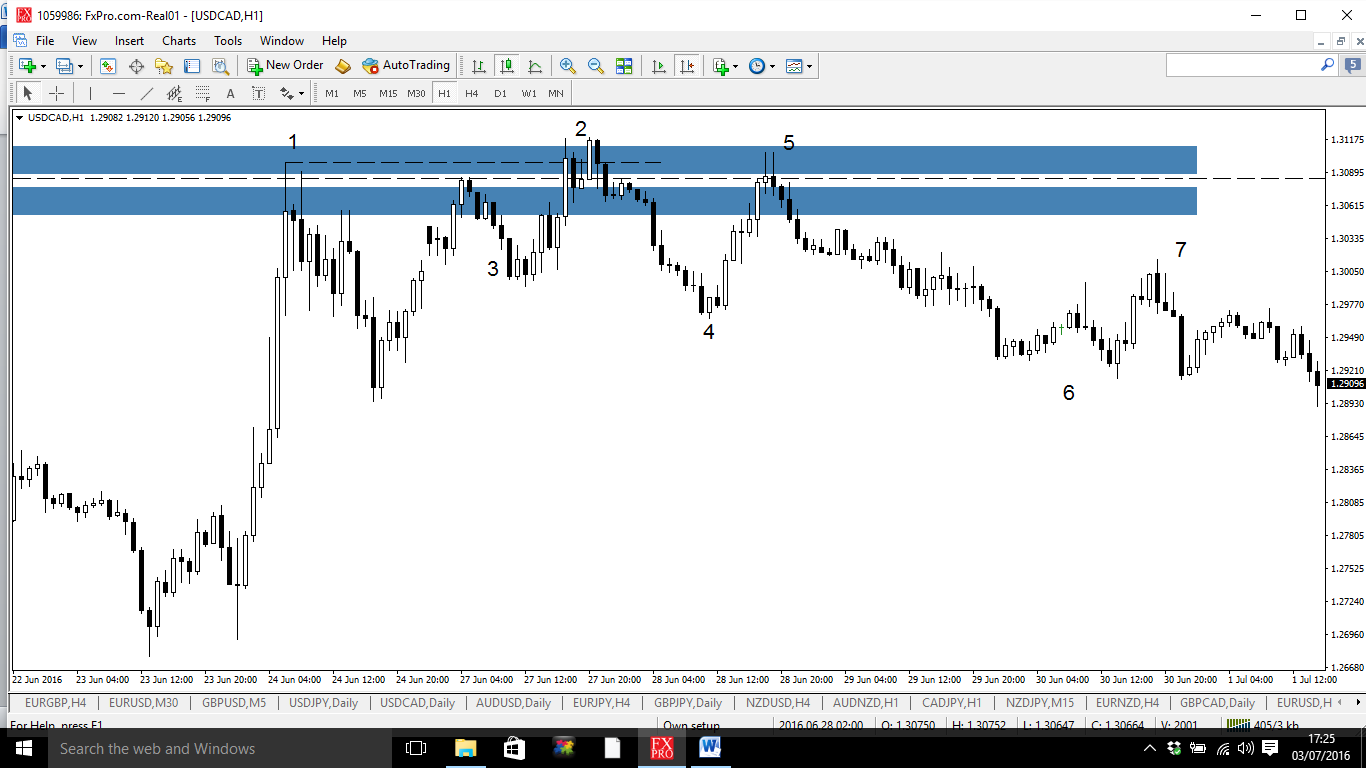
  1. The break of the HTF high we just mentioned.
  2. A break of a short term high. At two we can see this has broke the high formed at 1.
  3. We then mark the down candle before the upmove that broke this high.

picture 4

4. We see a break below the breaker candle (point 3). I see this as a break in market                       structure as the market gives a clue as to where it is going

5.Price trades up to test the old highs but does not break them. Respecting the bearish             order block which was created at 2 is a good sign.

6.Prices pushes below and this time stays and creates several candle closes below our                    breaker.

7.Price runs up to 7 which is our entry.


My understanding of why this happens:


The break of the HTF high

Price is pushed above the high for liquidity. By pushing price above this level the smart money triggers any sellers who have been moving stops lower above previous highs. These stops are buy stops. This means smart money can sell large amounts into the buy stops with someone else on the other side to take their trades. It also goes unnoticed as they are selling into a lot of buying and can almost disguise what they are doing to the untrained eye. Also, by breaking the high, they attract more buyers who think price had broke out and is gunning for new highs. Again, more for them to sell into.


A break of a short term high and drop below (turtle soup)

Here I think the smart money invest in sending the money higher from the breaker candle again for retail traders to think the market is again on its way to make a higher high, catch stops and get people on the wrong side of the market.

The break below the breaker candle

This seems to be the tipping of its hat that it may be going lower. However I think it may be the result of the smart money selling just enough to edge the market lower before it allowing it to come right back up to test the turtle soup/newly formed high. Sometimes we see a run to test the highs, sometimes we don’t. This is one thing I need to research more. Maybe larger reversals need 2 visits or more, lower time frames don’t.


Not breaking the newly formed high

This makes complete sense. If Smart money had put on large sell positions at the now highest point, why would they let price go back above this area? If they let price come above this high they would risk the possibility of more money coming in on the buy side and taking price higher, totally scuppering their plan, or at the very least, meaning they have to put on larger positions that they had planned to. This is a key part for me and to see this area defended and price move away quickly is a good sign in my opinion. Also, is this where smart money adds the final load/rest of its position which enables them to get more on at the best possible price?

Price closing/running below breaker.

This obviously differs on different time frames but price seems to settle below for a period of time with less volatility.


Price running back to breaker

Price runs back to the breaker for entry. Again this makes sense because if they are going to send price lower, why would they want them open buy positions to go down with them and reduce profits/carry a loss if they don’t have to? Now they are on the right side of the market (the side they know they are taking price) they can offload them positions at the same point they put them on. Maybe offloading these positions and selling is the final transaction which tips the scales for the market to go lower? It seems like the breaker is used as some sort of elaborate holding tool which keeps everything even and settle whilst they re jig everything around. Then remove the final piece and everything falls into place.


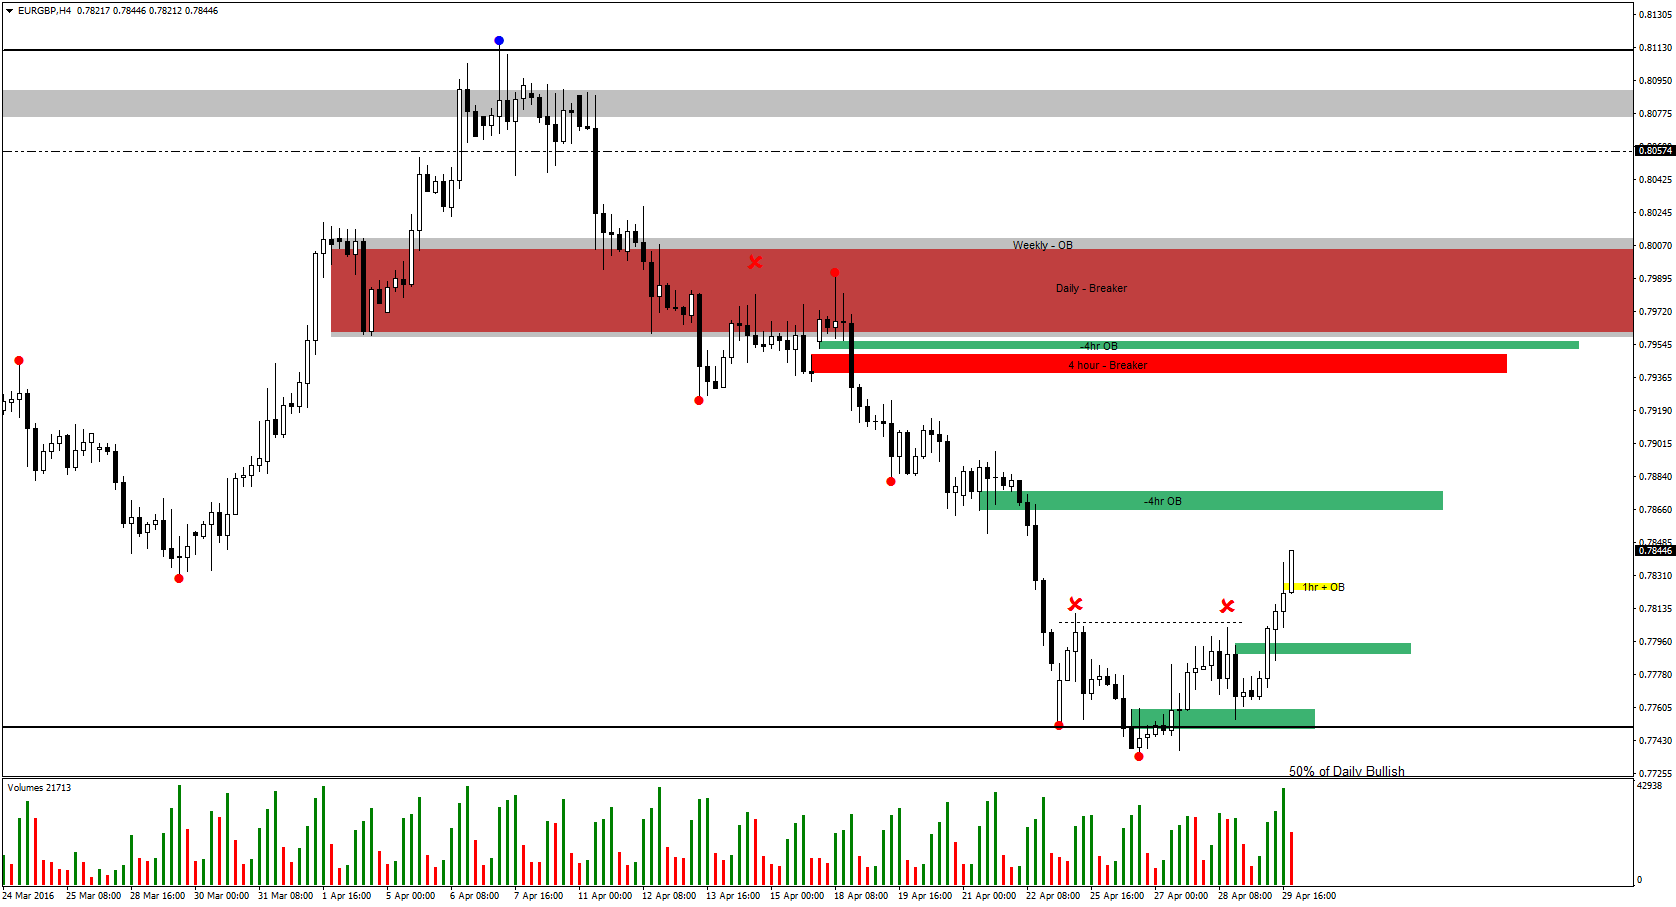
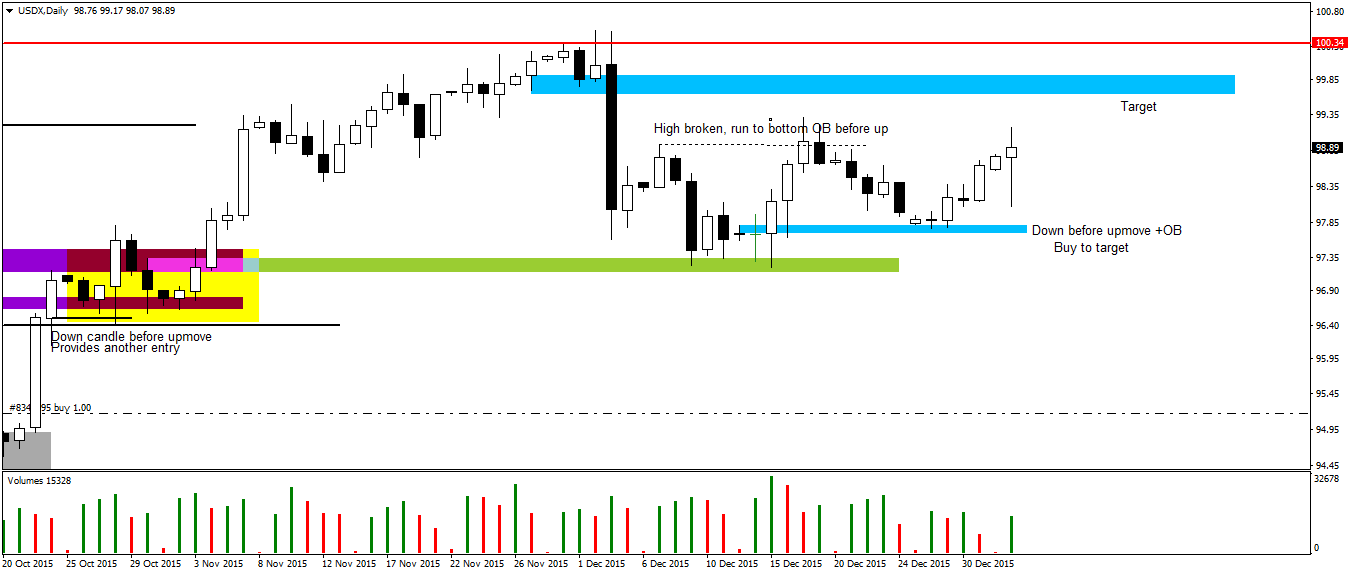
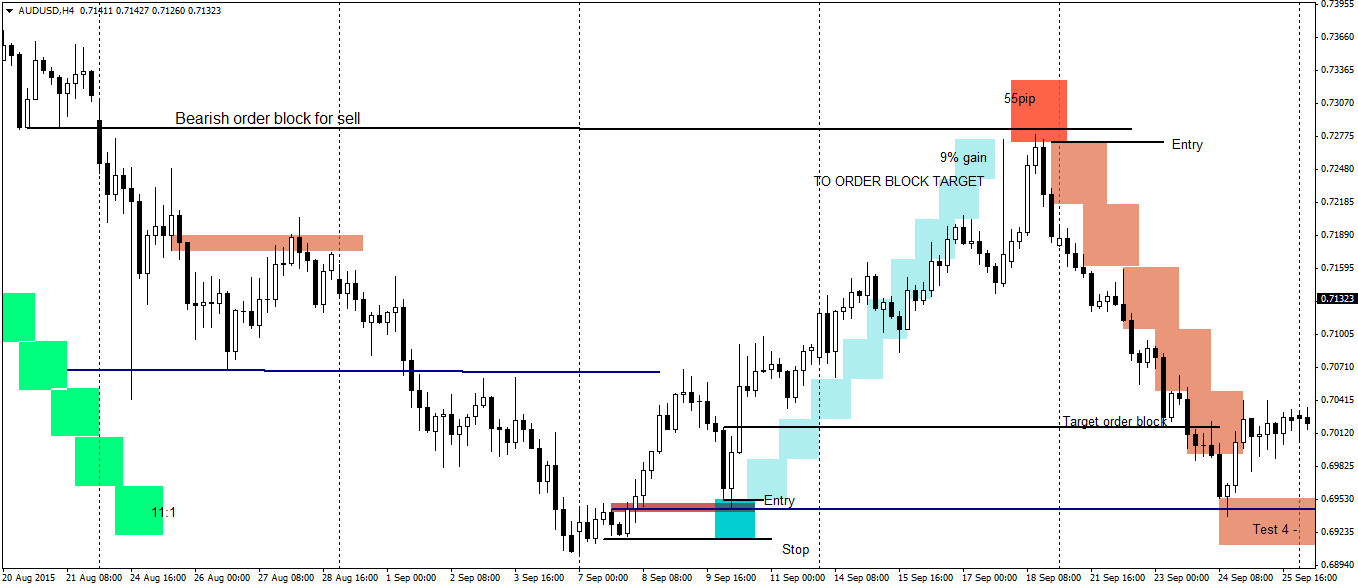
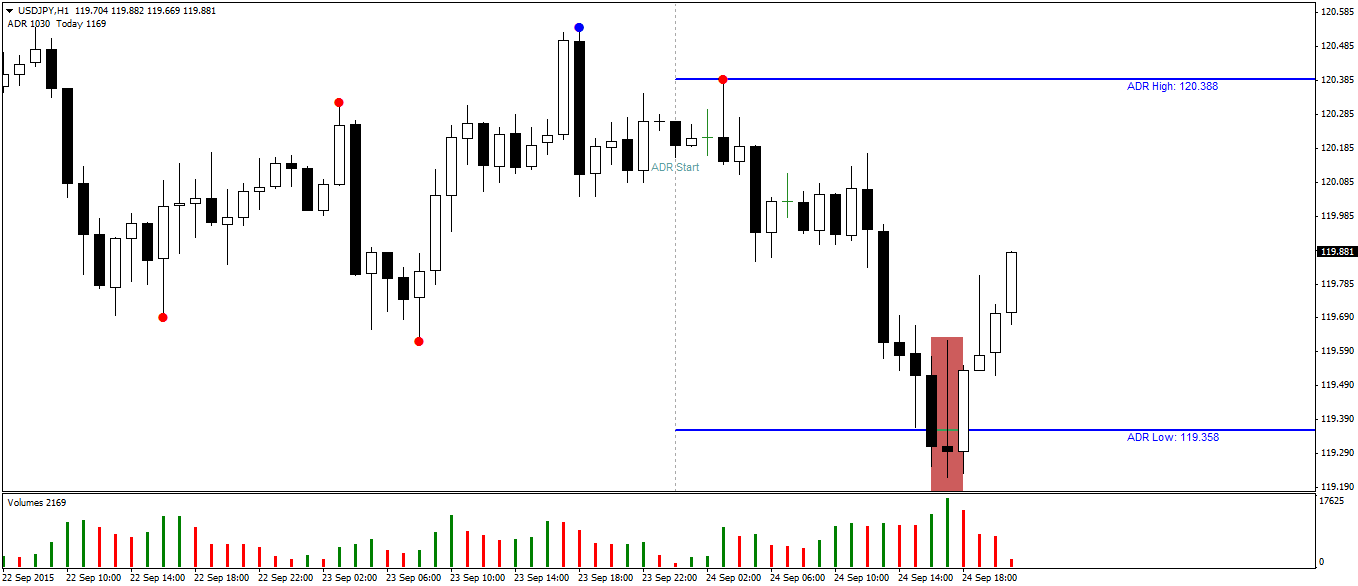
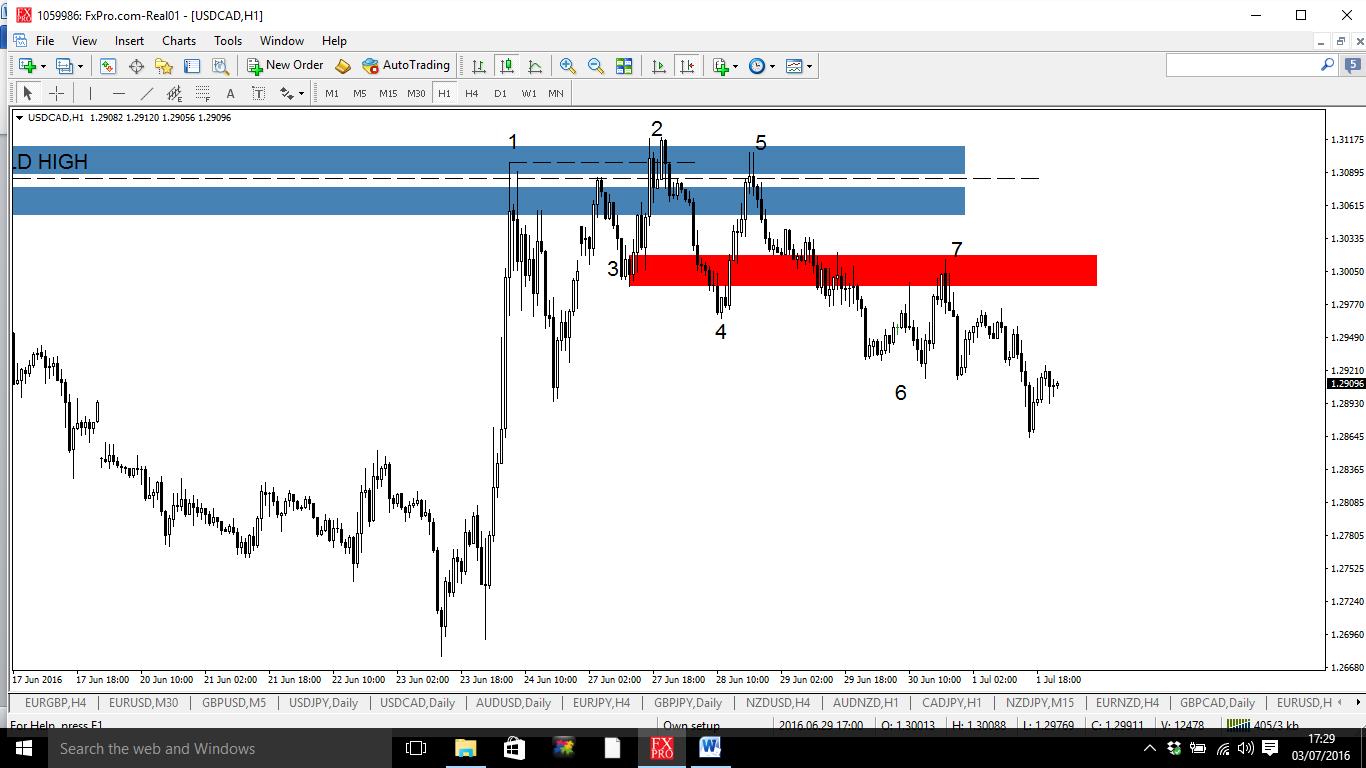
The trade I traded last Friday was in the same pair but on a lower time frame.

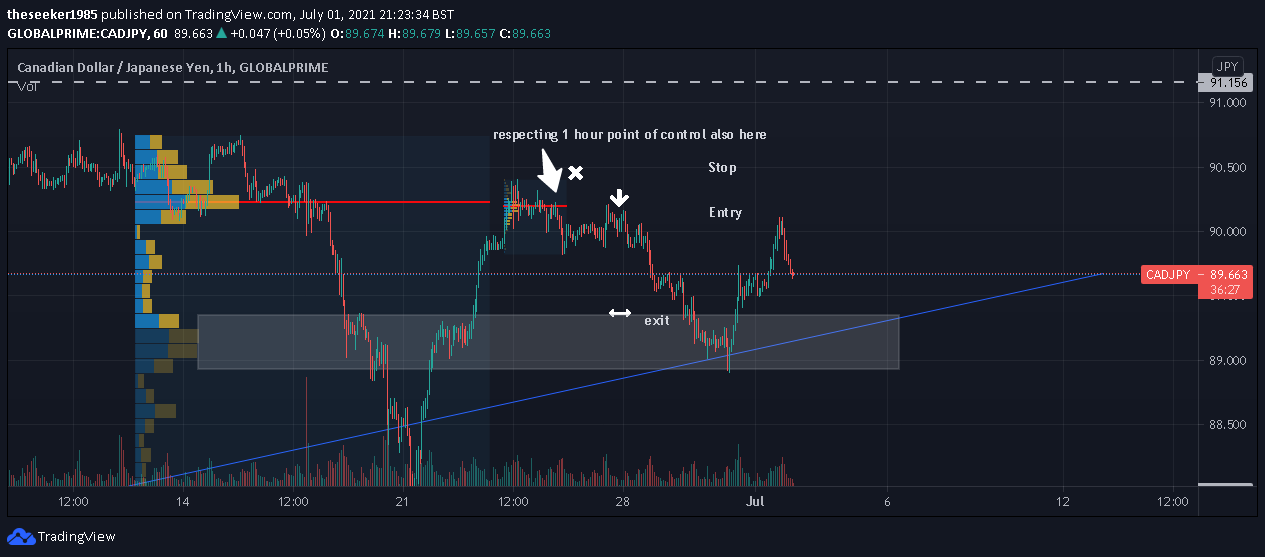
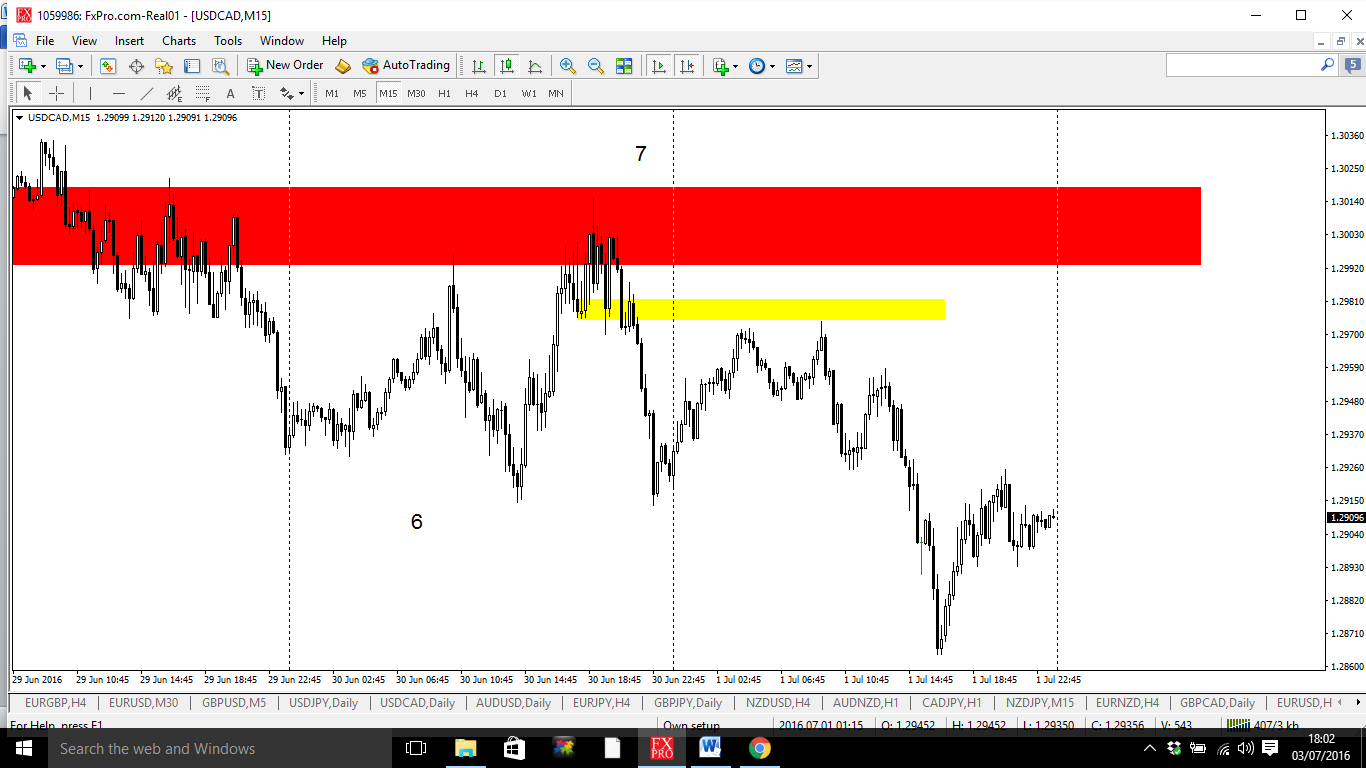
Here we have a 1 hour order block highlighted in yellow:

picture 5


This is a continuation of the breaker entry from above. (Entry at 7 on chart). If you have missed that entry I think this is a good way to get back in at an area very close to our breaker entry.

 picture 6

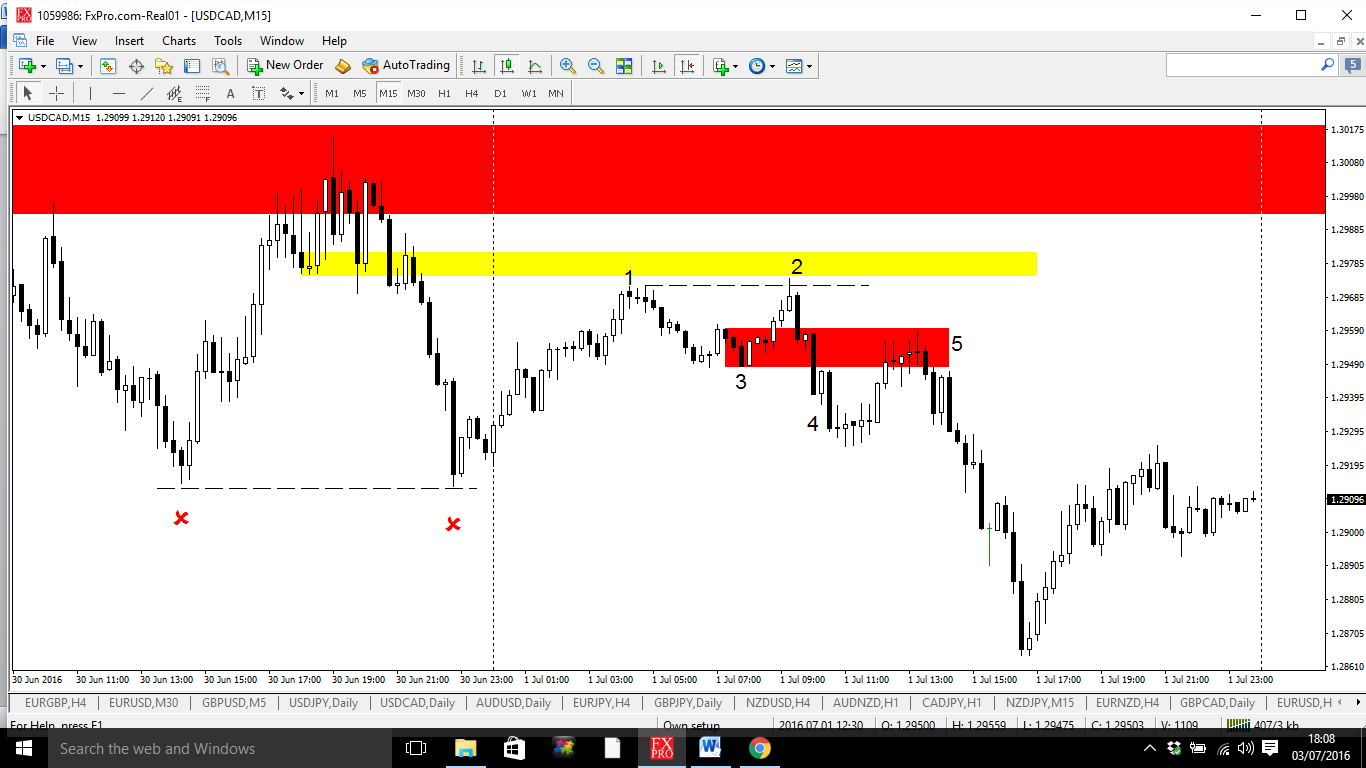
Firstly, a positive is the fairly clean lows left and this is another thing in favour of the sell. This trade/breaker was missing the run up and test of the highs at 2 but maybe that was because there was a much more obvious run and staying below the lows at 4 rather than the ‘tip of the hat’ break in structure on the last example. Or maybe because most of their position was added on the 1hr/4hr reversal which was larger and only just recently engineered.

Anyway:

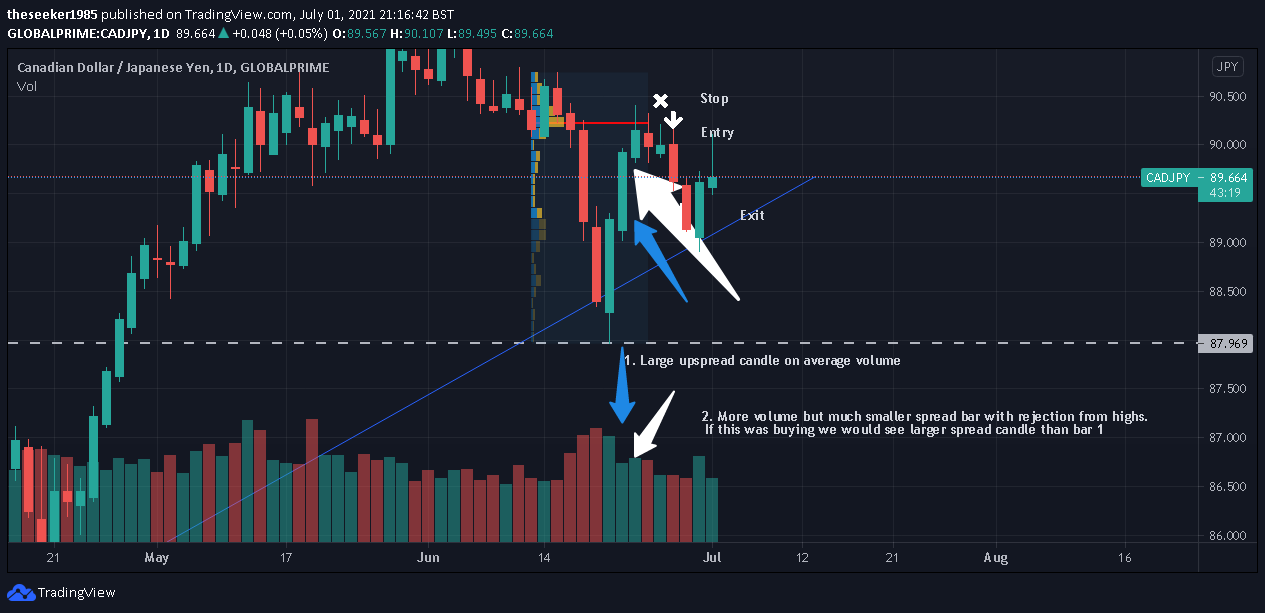
  1. A short term previous high is broken as price runs into a bearish order block.
  2. Price quickly rejects and breaks short term market structure of 3.
  3. We mark out the breaker candle
  4. Price closes and stays below the level
  5. Price runs up to and rejects off 5 which is our entry.

What I like about this is even if for some reason we were looking to go long it doesn’t meet the criteria for us to enter. For example 4 broke the lows at 3, but we didn’t see any of the other things happen so had no reason to consider entering long.

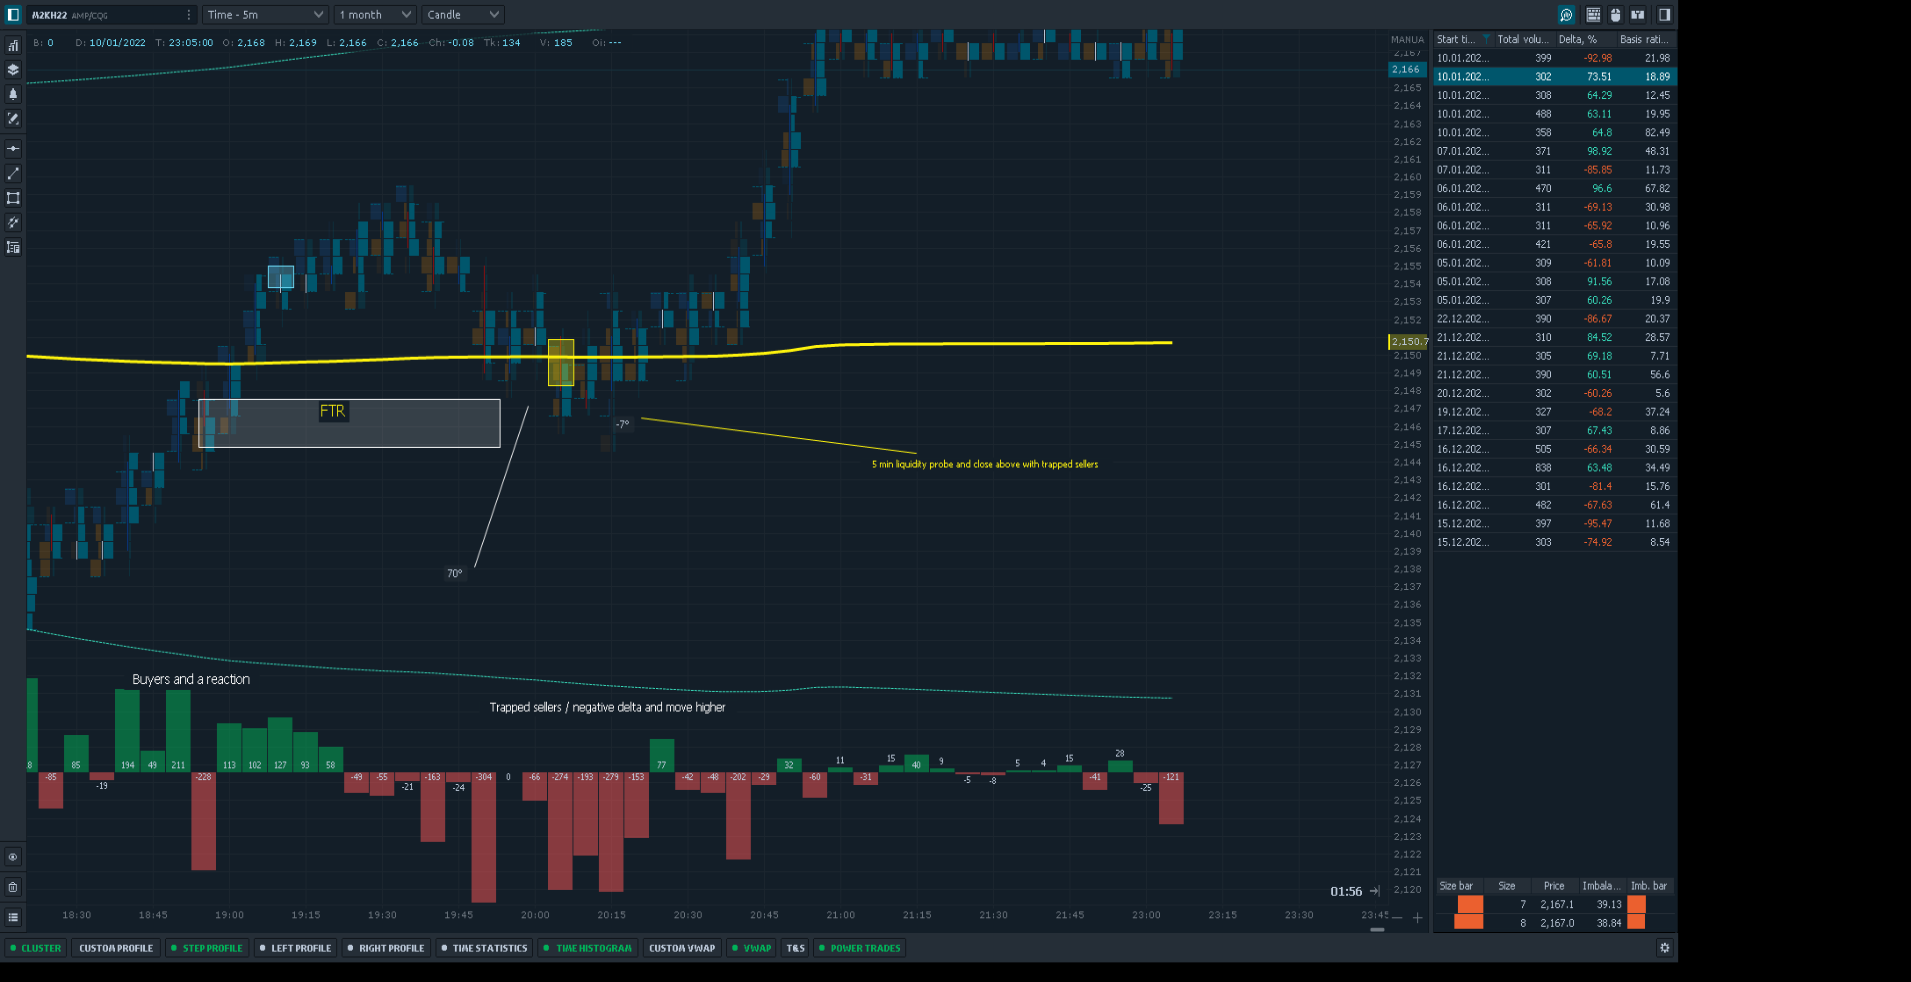
This is even greater  because we can go to a 5 minute chart and see the same thing again within the 15 minute pattern.

Picture 7

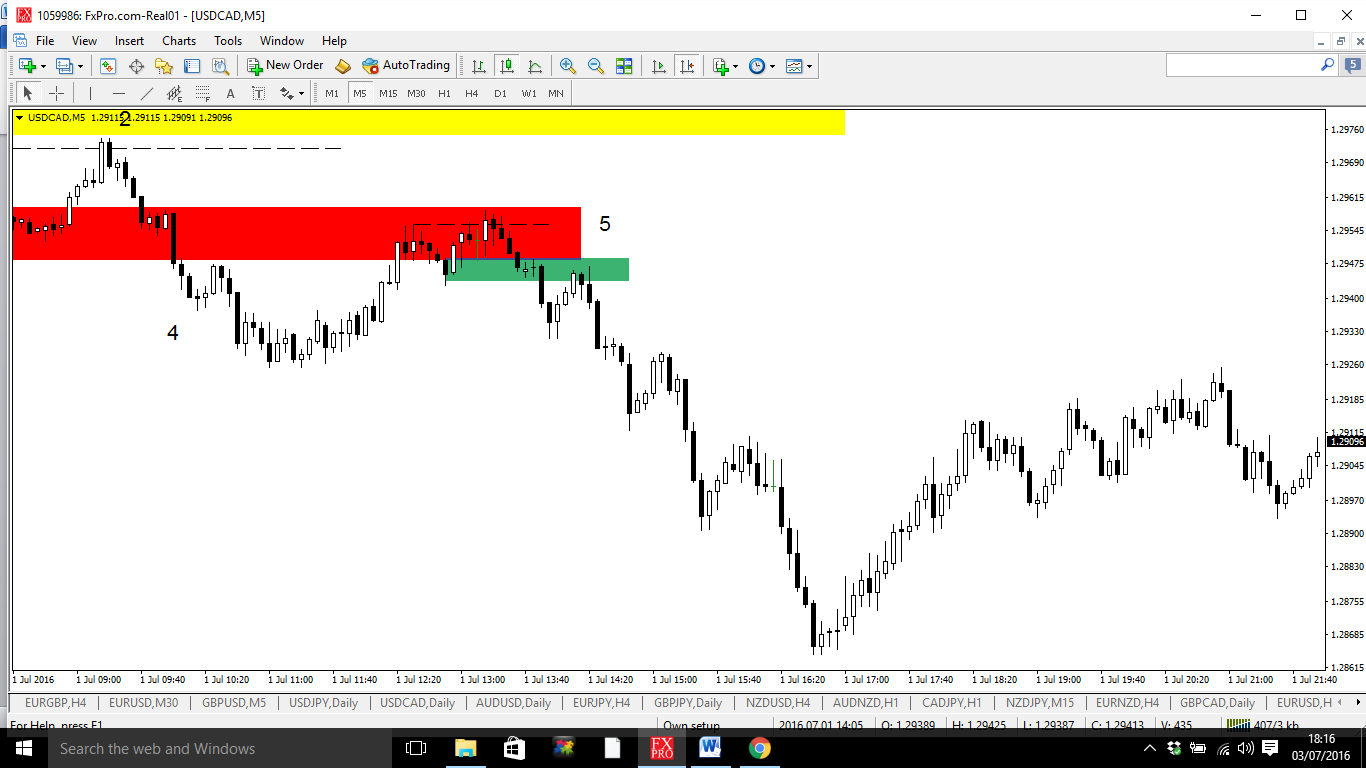
Number 5 above was our entry from the 15 minute chart. Now in this area within our breaker zone we have a 5 minute model which does exactly the same thing. A short term high broken into one of our areas (order blocks, breaker, etc) , A run and stay below, a pop up to our 5 minute breaker (green rectangle), Our Entry.

Having followed several superb traders who use ICT’s work on twitter for the last month or two what I love about this trade entry is tight stops which takes the risk:reward ratio to a different level if you can be brave and trust what you are seeing.

The only thing I am wary of is testing the old highs which would stop me out if I enter a breaker without that first happening but I am sure with more experience and examples I will work that part out.


ICT said in a recent video about deciding what you are going to trade and you will see it in the right areas in line with institutional order flow whether it be turtle soups, order blocks or breakers.

What I am seeing is all 3 of them. A turtle soup, a break in market structure, a respecting of an order block, and a breaker. All of these happened in the area of a daily order block. All of these happened in the area of a 1 hour order block.

Trading Ideas for w/c 2nd May 2016

This week I plan to not take any huge risks. Mainly because there is a UK bank holiday on Monday and non farm payrolls Friday. I would like to get in a trade Tuesday and be out for Thursday. This means I will be looking for a high probability but short term move.

My analysis will still be based on the higher timeframes however as this is where the highest probability trade ideas are formulated.


USDXWeekly

I have started with the USDX weekly chart which shows a number of bearish weekly order blocks have been respected. The USD index is now in a position where it looks like it has broken the lows of the long consolidation we have had for the last year.

I will be watching this closely in case of any turtle soup scenarios but maybe non farm payrolls will be the catalyst in sending this pair down toward my first bearish target of 89.55.

If we see signs of buying in the dollar the first target would be to get to the first bearish order block between 94 and 94.50.

I am therefore bearish on dollar going into the week which means I am BULLISH on foreign currencies.

USDXDaily3004

This is the daily chart and I have added this to show a breaker marked in red. This is the down candle before the upmove which took out the stops running into the bearish weekly order block. If dollar continues to be bearish we may see a run up to here for Tuesday, creating the high of the week before continuing lower.

I will next look at the EUR/GBP.

EURGBPWeekly

This shows that over the last 3 or 4 weeks EUR/GBP ran up high and took out a series of weekly stops before reacting at the Weekly bearish order block above these and respecting the 50% level. This is a classic high probability trade. Taking out stops into an order block.

Price has ran down fast but has shown signs of a reversal  last week.

EURGBPH4

Looking at the EUR/GBP chart on a smaller time frame we can see how the smart money reversal ocured at the 50% level (from higher time frame chart above). It created a reversal pattern where the second part of the reversal respected the bullish order block rather than turtle soup the lows.

Price is now running up but has several layers of resistance up ahead. I do not think price will run back up above the weekly highs as that took a lot of liquidity. I think price will come unstuck in the area which has a combination of Weekly order blocks, daily breakers and 4 hour order blocks all bearish.

If price pulls back early in the week I will look for bullish euro up to the level of the 4 hour breaker.

A bearish dollar and a bullish EUR/GBP means that I should be looking at longs this week in the EUR/USD pair.(EURO STRONG VS DOLLAR WEAK)

Here is the weekly chart and to me I see a Market maker buy profile. I have added a no demand/supply indicator here just to confirm my views. Basically this indicates falling volume on candles (must be less volume than the previous two). It is from the Master the Markets book/pdf by Tom Williams and I have noticed that as price falls into a order block it does so at reduced volume. I think this may be great to incorporate/help validate my views especially at Weekly order blocks for big moves and its something I am going to keep tabs on.

EURUSDWeekly

I think the weekly bearish order block marked in silver should be the next target. Price created some new highs during the long consolidation before running back to the order block at the initial point price stopped falling.


EURUSDDaily

On a Daily chart I have noticed that price falls back to lowest order block when it has been in a consolidation. This chart shows that key bullish order blocks have been respected and new short term highs. If we do get a bearish dollar this should see this pair start to break the 3 highs marked on the weekly chart and run higher.

I will be allocating 1% risk to this trade.EURUSDDailybreaker

This breaker is the area I would be looking to buy from should price pull back on Monday. This is the bullish candle before the move down in bullish order block where stops were taken.


End of YEar (first 4 months results)

I became a bit lazy, especially in December, being busy at work, preparing for Christmas and a trip to Disneyland so did not spend the right amount of time studying the charts.

I held a series of positions which kind of went into a few % profit back to break even and back again a few times. I finally exited for small profits but could have managed that better.

One aim this year is to focus more on evenings and prioritise chart analysis and everything becoming second nature.

I have attached below my results for the first 4 months of this system to the year end. I haven’t absolutely followed it religiously as I have probably missed many setups when I was not analysing, but anyway, results below.


monthly change jan


My aim is to get back to the 4 and 5% of September and October but I am pleased my account is still making a profit.


USDXDaily4th January

Above is analysis of the USDX which I have been looking at recently. Once again a Market maker model is forming. The previous short term high was broken before the run down to the bullish order block with the target being the top blue negative order block. So short term I am bullish dollar to this point then  will look at reactions at this level and potentially the very clean highs at 11.50 to be taken out.


I will post my currency analysis when complete throughout this week.

October Results and holding losing positions

Last time I posted I talked about the Market maker model running to complete the model and this is why I was bullish. I have attached the USDX chart below and as you can see this has just about completed as expected.

USDXDaily011115

This shows the MM model as previously described in an earlier post. Both blue lines are Order blocks which were used in the move down and now become my targets for the Bullish move up. The reason I target this are that once at these points the probability of price to continue moving higher may decrease.

Below is a 4 Hour chart.

USDXH4

This shows how once the highs were broken at around 96.50 (dashed line) price returned to the order block to make what most people describe as a double bottom. When in this area around 93.70 we seen a nice bounce indicating smart money was going to use this level. However we did not see huge volume at this level. I am still not an expert on volume but I believe that the huge volume at the first bottom on the daily chart was where they got in most of the buying.

My Trades this month

When I seen a bullish dollar I entered several setups in favour of the order block at order blocks on several charts. One thing I have found is sometimes price does not always run right back to the original order block but sometimes we see a smaller retracement.  I decided to trade one of these but with the smallest position size and a larger stop. This in hindsight was a bad decision and something I have learnt.

Only one of my stops from 6 trades was hit but I had to sit through 2 weeks of drawdown until the full effect of the bullish dollar took its toll on my trades. This did two things:

  • It increased my risk meaning I could only trade the smallest lot sizes.
  • It meant I had a lot of drawdown
  • It meant I could have risked more with a tighter stop at the original order block which would have kept my risk the same but doubled my eventual profits.

In future I will look to enter at original 4hr and daily order blocks if possible. Although in a trending environment I may miss trades this way.

Below is one of my winning trades. I entered at a great position with very little drawdown and exited around 5 times my risk.

EURUSDH4 winning trade

Testing

I have been testing my strategy and tweaking my plan as I would like some statistics of what my average risk to reward would be in certain pairs. I have not gotten very far with this but here is an example of what I have been doing.

AUDUSDH4

Although this looks messy and there are probably much easier ways to do this, this is how I am testing my strategy. It basically involved entering 5 pips above or below an order block(depending on if its Bearish or bullish) with the stop being the other side of that order block. It is also only traded on the first visit back to the order block. Order blocks used are ones which have resulted in a fast up or downmove as this is where buyers/sellers look to come in and get any remaining orders in.

My Entry and stop is the dark turquoise square and the lighter colour after this is the multiples of this risk the trade has run to.

So far on the AUSUSD I have tested 7 trades.

2 trades would have lost 1%.

1 Ran for 1:11 RR (11%)

1 ran for 1:9 RR (9%)

and the next 3 for 5-6% each.

Obviously I need to do months and months of testing of this strategy but during the last 2 months that would be around 33% gain just trading one pair. The aim here is obviously to cut the losers quickly, have a very specific entry and hopefully be in positions to let my winners run. The fact we are trading on 4 hour and using daily charts and order blocks as the highest probability followed by 4 hour means that I should get nice runs when I am right rather than being stopped out on shorter timeframes.

MONTHLY RESULTS

Below are my results for October. My aim is 6% per month to double my account by the end of the year. Ambitious but I feel it is achievable as long as I am patient waiting for entries and use correct money management to make sure I enter at the initial order block and manage my lot sizes so risk does not exceed 1% on a trade.

myfx book october

Monthly Analytics

If I could improve one thing I guess it would be that I have made  over 1300 pips in 2 months and this has only been a small amount of monetary profit because I have started with a small bank. If I can post similar results next month using this strategy I will consider adding  to my account each month to help with growth. For now though, I feel my knowledge is growing with each trade and the combination of order blocks, USD index, Volume Price analysis, Market Maker models etc is giving me a good overall feel for the market rather than just relying on a technical indicator. It has been around a year and half since I first found forex and I feel I am learning and making progress.

Week 1 Results

I am very happy with these weeks results and decided to exit my positions.

My reasons for exit were high volume bars with a narrow spread, signalling a lot of activity. This may result in a small term retracement to a recent negative order block on all 3 trades. I decided to take profits at these point and will watch again into next week to see if more Sell Set ups show up on these pairs.

One reason I am keeping my bullish USD stance is that the USD has been making a market maker buy model and has yet to complete.

Below is the chart.

usdxdaily

This shows a market maker model which I  have highlighted in a previous blog. Targets are for the USDX to reach 97.50 and then 98.30 potentially. The USD index shows the relative strength of the US Dollar and this is why I shall be keeping a bullish bias.

Reasons I closed trades

USDJPYH1 showing high volume

This is the reason why I closed Trades. As you can see a low spread candle formed with high wicks breaking the lows and the highs. This can also be known as a long legged doji. The volume was far greater than the previous bar. This much volume should have created a much larger down candle where we still bearish for the short term.

Instead this high volume indicated too us that something else was going on. The insiders were taking profit or buying up some of this pair. The falling volume on the 3-4 candles afterwards suggests that there is no interest to the upside yet and this is merely a retracement. Therefore I will be looking to re-enter the trade at the bearish order block we are approaching although this pair is ranging so I am slightly more catious so would like to see it hold first.

As you can see 3 hours after I entered the candle has quickly moved back to were I initially entered. This is why volume was a great warning sign to get out whilst profitable.

MYFXBOOK Results

Below are my fx book results for the week. I have taken 3 trades which were all profitable. My order sizes are very small and I have had to gain a fairly large 352 pips for 2.5% of my equity.

This is something I must work on. I should have been rewarded much greater in terms of percentage return for these trades. I must narrow my stop loss which means I can increase my order size whilst maintaining risk percentage. In doing this I should be able to double or triple and profits. The downsize to this is a greater chance of my stops being hit. This is a fine balance and the money management side of trading is the biggest factor in success or failure.

Below are my results:

myfxbook week 1

I am nearly 50% on the way to reaching my target of 6% a month in week one and very happy with these results. I am just concerned I have to find such big moves each week and that is why it is important to work on tighter stops and greater lot sizes. If I can do this I should find reaching my 6% target much easier with the potential to exceed. 6% a month will double my account every year and this would be a fantastic return.

This weeks orders

I am currently in 3 positions this week. However I missed my sell limit order entry for both the EURUSD and the GBPUSD this week for over 300 pips. One of the disadvantages of trading only on an evening is you do not know your order was not triggered till you return home from work to the charts. I should have looked at logical points to get in on the trade for the remaining part of the move but decided not to chase price.

My limit orders both missed by around 5 pips so in future I will try to lower my entry slightly rather than be right on the edge of the order block. At present I am trading with very small lot sizes and fairly large stops so 5 pips will not be critical in monetary terms.

The trades I did enter

Trade 1 – AUD/USD

AUDUSDH1 entry210915

I entered this trade on Monday. Reasons for entering were a reversal pattern on Friday. A climactic high volume candle and a break in market structure breaking the previous swing low. The pair has moved lower and is now making lower highs and lower lows.

I am aware of potential bullish order blocks and will be looking for any high volume candle signalling a reversal in these areas. If this does not occur my target is bellows of 0.695. I have now moved my trade to Break even. We would be expecting the low of the week to be made on Thursday so I will reassess this trade tomorrow.

Trade 2 – AUDCAD

I entered this trade on Tuesday. I saw a market maker sell model and marked a 1 hour bearish order block were price had moved from on Monday. The Tuesday Judas swing sent price up to this level almost to the pip and sent the trade straight into profit. I am very happy with the execution of this trade.

My aim is to perfect this type of with trend trade and increase position size/reduce stop loss and maintain risk% of 1%. This is hard at the present as I have to identify potential order blocks the night before. I hope within time to become much better at picking these areas and where to expect big price movements.

AUDCADH1entry210915

For this trade my target is slightly more conservative and at the bullish order block around 0.9265.

Again I will monitor this trade for reversal patterns. At present I am applying volume price analysis on higher time frames, namely the 4hour and daily charts simply as I only have an hour or so on an evening. This, at present, is keeping me in the correct direction of the higher trend.

I was a little disappointed this week to just miss entry on 3 trades which would have yielded 1-2% each in profits but I am happy that my analysis was correct in those trades and I would have been in profit, plus the two trades I am currently profitable in.