I have not spent much time anaylsing and trading recently due to house move. Beginning to get back into things in May and here is my analysis.
I became inconsistent with my trading and following my plan recently ( probably due to the lack of time). I have created a flow chart which I will be using to get me back on track. Sometimes I need a rigid framework to get back in sync with the markets. I also use Edgewonk trading journal and that has shown a lot of trades which do not follow my plan.
Here is a link to my flow chart. It may look confusing but it makes sense to me and that is all that matters!.
https://miro.com/app/board/o9J_lHP__Xk=/
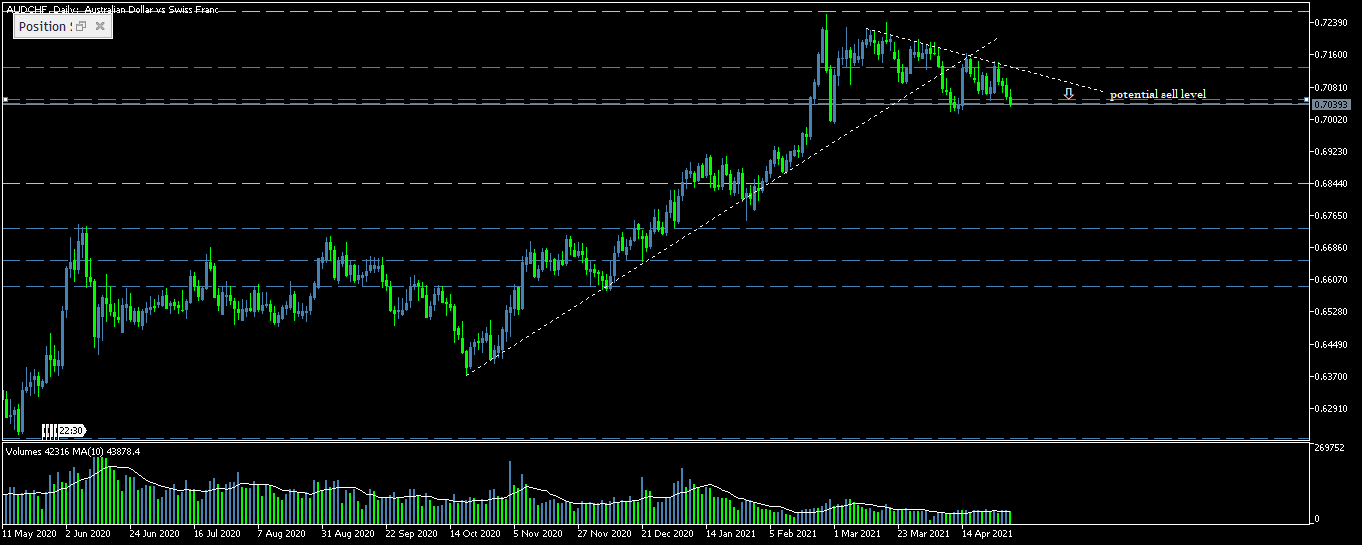
AUD/CHF – Daily
AUD/JPY – Daily
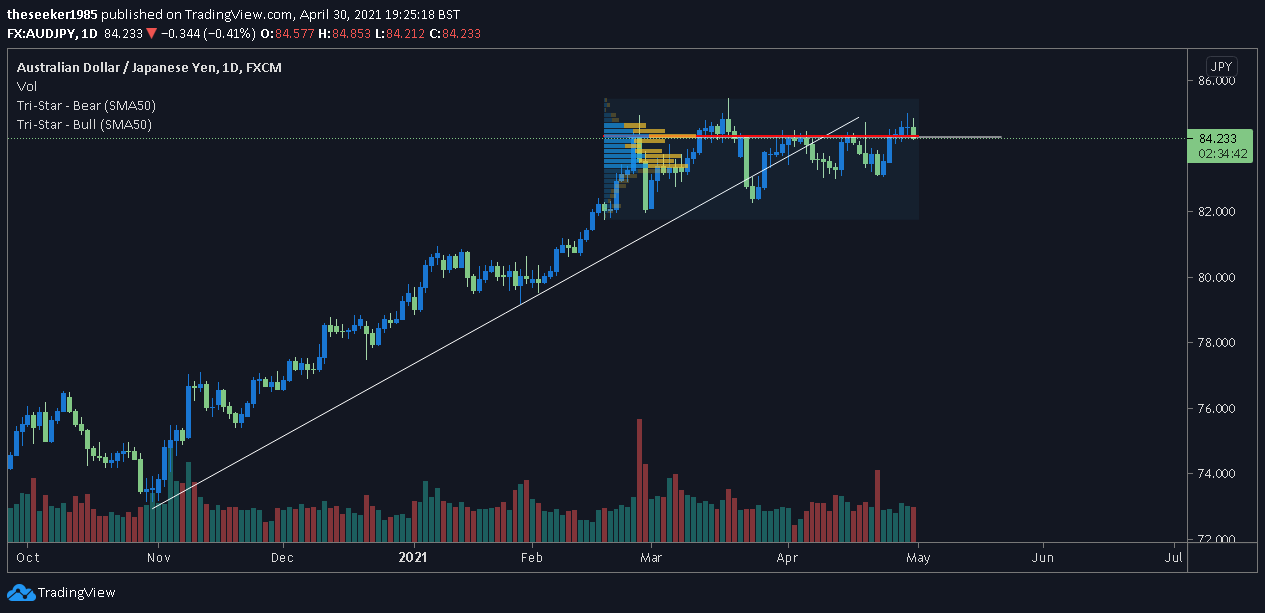
We have also broken an uptrend on AUD/JPY and an opportunity to short has appeared (my entry). However, price has yet to close through the key level that I had marked. This key level is also a confluence with volume profile for this period, which also happens to show the most volume traded at the same level. A close below would be a good indicator and would be my trigger to sell with a target below the last 4 lows where no liquidity has been taken at any point.
EUR/USD
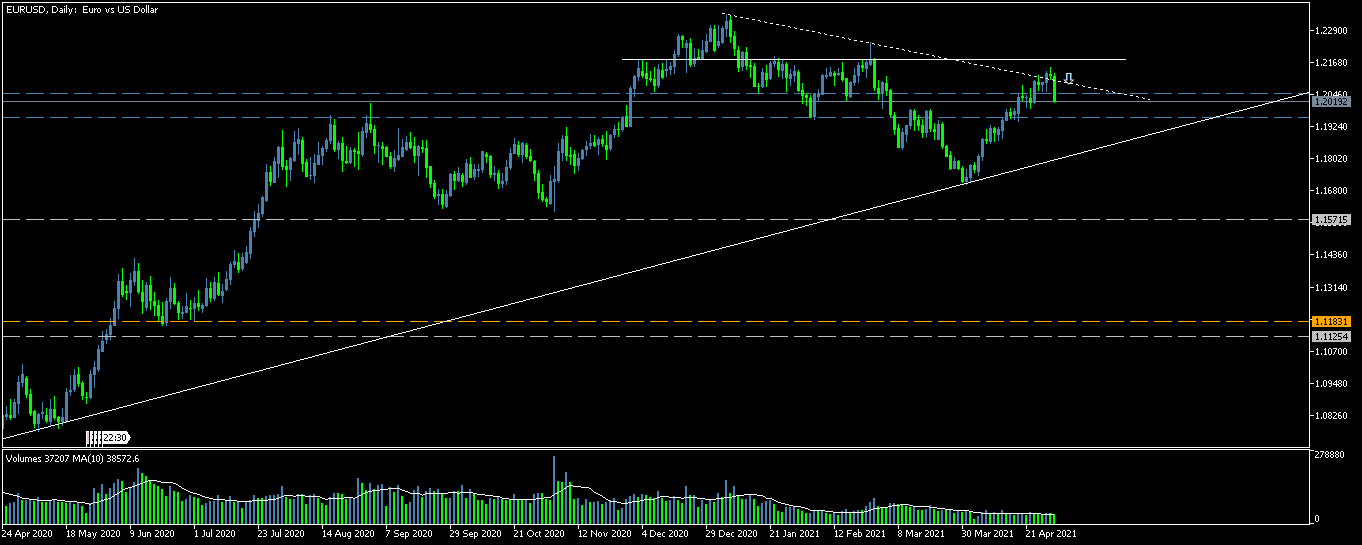
Below Key level and with counter trend line. The high near arrow is also the volume point of control of the area to the left. This shows there was selling near the solid white horizontal line and sellers appear to be adding more here.
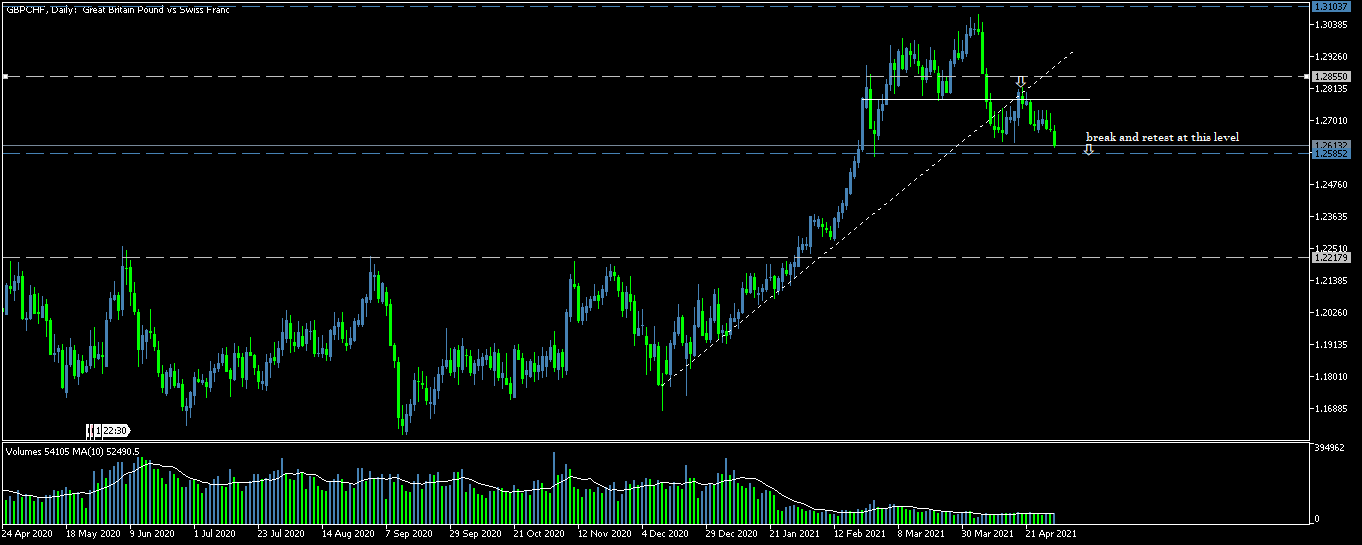
GBP/CHF
Shall try to add more as the month progresses and document a few trades I have made, winners and losers.
