A Trade from this week using volume price analysis

As you may know, I use a series of differing concepts in my trading. Volume price analysis always made sense to me since I bought Anna Coullings book 5 or so years ago.

Around the same time I stumbled upon Inner circle trader and took on board some of his concepts, mainly hunting for liquidity, amongst other concepts.

Along with these traders I have also been inspired by Tom Dante (break and retest and swing failure patterns) .

A lot of these concepts overlay each other and are very similar in nature.

I put these together and my general approach uses volume profile, volume price analysis, along with basic support and resistance and technical analysis. Liquidity raids (or turtle soups) add an extra confluence .

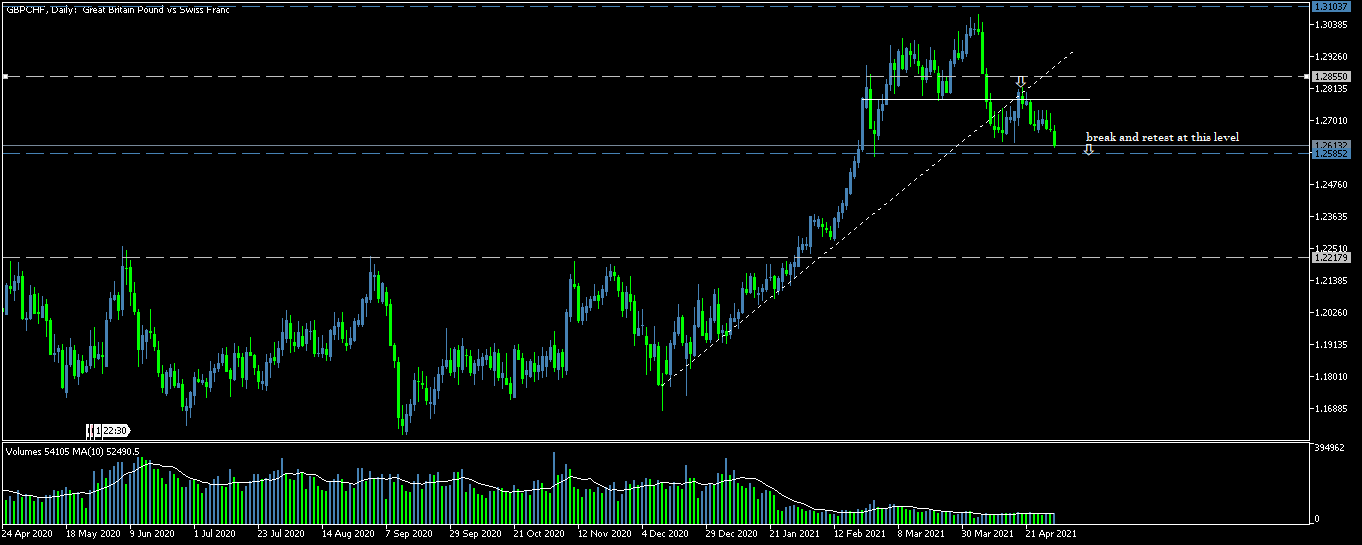
Here is a trade that I took on Monday.

The Volume profile marked here was marked to cover the large move down, as well as the consolidation area before it as well as the move up . The reason I covered such a large area was that I was interested in the V shaped potential bounce from the trendline marked in blue. My initial plan was a buy with the trend . However, as I watched price unfold I seen that most of the volume continued to be higher up. This gave a big clue that the major players were selling. As price came back to this area.

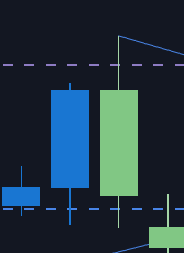
Another huge indication that we would be having some sort of a move lower were the candles on the way back up to the point of control.

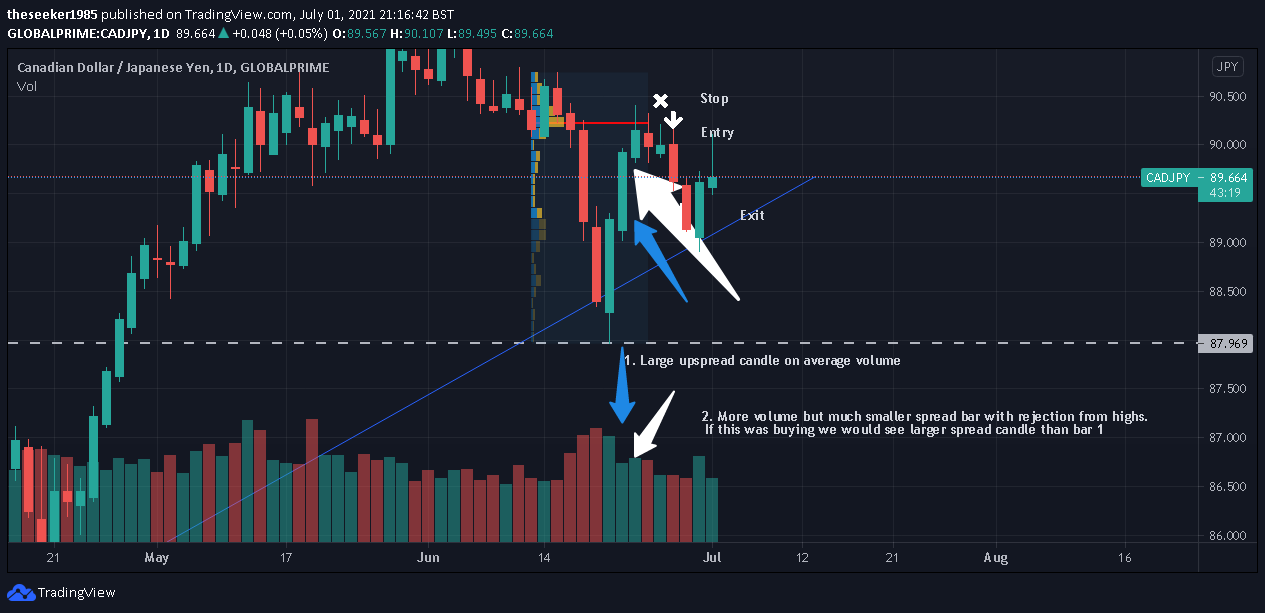
I have labelled a chart below. At point 1 we seen a large up candle on average volume. This was then followed by a much smaller up candle with rejection at the highs ( from the point of control) as well as an increase in volume. An increase in volume would have created an even bigger up bar if this volume was buying.

This indicator, coupled with the point of control being at the highs and very little visible selling around the trendline was what gave me the confidence in this setup. My target was fairly conservative, at the next node of higher volume as indicated on the chart.

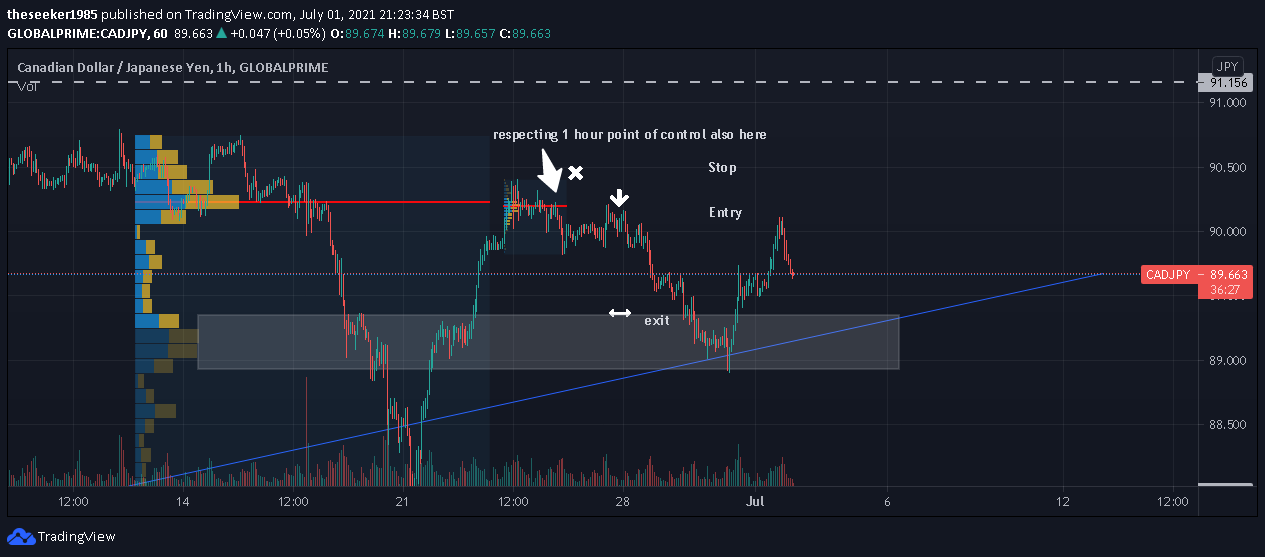
I have also added a one hour chart showing how there was a very similar pattern emerging on this timeframe. We see a fast move down and the most volume from that move down being shows at the high. As price then retests the area we see rejection from the point of control.

Analysis May 2021

I have not spent much time anaylsing and trading recently due to house move. Beginning to get back into things in May and here is my analysis.

I became inconsistent with my trading and following my plan recently ( probably due to the lack of time). I have created a flow chart which I will be using to get me back on track. Sometimes I need a rigid framework to get back in sync with the markets. I also use Edgewonk trading journal and that has shown a lot of trades which do not follow my plan.

Here is a link to my flow chart. It may look confusing but it makes sense to me and that is all that matters!.

https://miro.com/app/board/o9J_lHP__Xk=/

AUD/CHF – Daily

Will be looking for a break and retest at the arrow. Price has broken the uptrend and I am already in a short position from 0.715. This trade was taken as the uptrend was broken ( trend reversal). We then also had a break and retest of a key level as well as confluence with the down trendline. It is worth noting that as of yet the down trend line does not have as much strength as the uptrend that came before it and therefore may only be more of a corrective phase before another move to retest the highs.

AUD/JPY – Daily

We have also broken an uptrend on AUD/JPY and an opportunity to short has appeared (my entry). However, price has yet to close through the key level that I had marked. This key level is also a confluence with volume profile for this period, which also happens to show the most volume traded at the same level. A close below would be a good indicator and would be my trigger to sell with a target below the last 4 lows where no liquidity has been taken at any point.

EUR/USD

Below Key level and with counter trend line. The high near arrow is also the volume point of control of the area to the left. This shows there was selling near the solid white horizontal line and sellers appear to be adding more here.

GBP/CHF

I am already in this trade short from the first arrow. The first trade was simply a break of trend line (trend reversal) as well as a break of key level (push lower). Both of these where then retested at the same point (confluence) along with a valid entry pattern.

Shall try to add more as the month progresses and document a few trades I have made, winners and losers.

Analysis August 2020

I have decided to start writing my blog again as I feel it helps my thought process and question my trading in a good way. When we are sharing things, we check it makes sense and for me it further enhances my understanding of what I do and do not know.

Without this process I find myself almost trading on autopilot and not really checking how setups relate to my plan. So I will continue to blog to aid with my own development and if it helps others, great.

I now try to trade with Monthly and Weekly larger moves, and look for setups within this on the daily time frame.

I tend to take setups at Key support and resistance levels with confluences from trend lines, liquidity hunts (stop runs) and occasionally a moving average.

The two setups I will be trading are Bearish/Bullish engulfing candles and a 3 candle setup, which involves lower lows for sells and higher highs for buys.

Engulfing

Bearish Engulfing

Key Features of an Engulfing bar ( for me)

  • Body of candle 2 closes below open of candle 1 for sell
  • Body of candle 2 closes above open of candle 1 for buy
  • Price is at a Key level

Other confluences which can aid:

  • Liquidity has been taken
  • With Trend
  • At a Trend line for confluence
  • Volume of candle 2 is higher showing more activity and a strong response.

I then mark the body of candle 1 with a fibonacci and mark 50% of the candle. I find that on successful trades, often price comes back to this level before rejecting further.

I am in the process of collecting stats on a 50% entry as a limit order compared to just trading after candle 2.

There are several options however –

  • Entry after candle 2 formed.
  • Limit order at 50%
  • Watch 50% and wait for further rejection at this level

Of course you may miss many setups by waiting on 50%. However, the Risk reward ratio is much better, and quality of trades is better than quality.

I have added an image showing a confluence of factors which personally gives me more reasons to enter a trade.

Rather than just trading a specific pattern, I try to look for a series of reasons and confluences. 

Getting out of a trade is always the trickiest part in my opinion. The next Key level of trouble area has a higher chance of success, but I like to try and stay in when a trend is on my side until it is broken.

This is more often than not easier said than done and one part of my trading I am working to improve.