As you may know, I use a series of differing concepts in my trading. Volume price analysis always made sense to me since I bought Anna Coullings book 5 or so years ago.
Around the same time I stumbled upon Inner circle trader and took on board some of his concepts, mainly hunting for liquidity, amongst other concepts.
Along with these traders I have also been inspired by Tom Dante (break and retest and swing failure patterns) .
A lot of these concepts overlay each other and are very similar in nature.
I put these together and my general approach uses volume profile, volume price analysis, along with basic support and resistance and technical analysis. Liquidity raids (or turtle soups) add an extra confluence .
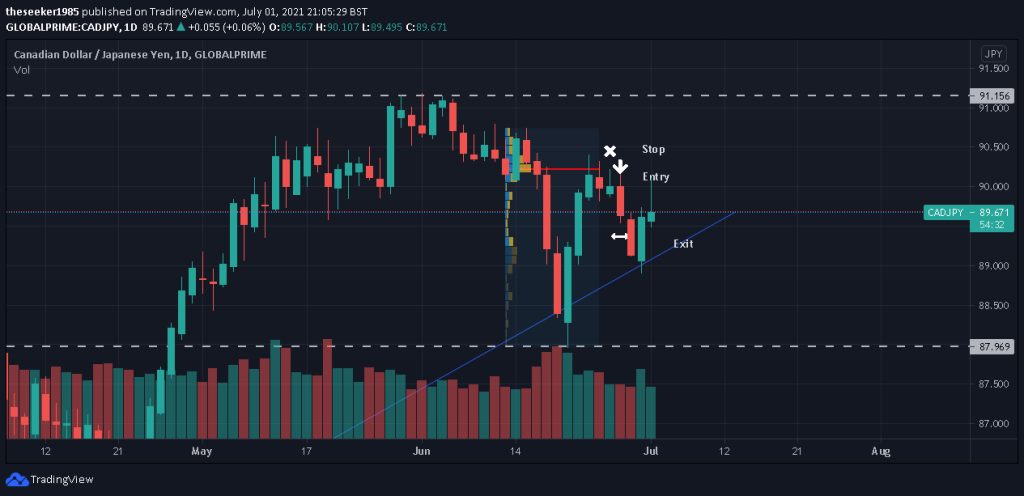
Here is a trade that I took on Monday.

The Volume profile marked here was marked to cover the large move down, as well as the consolidation area before it as well as the move up . The reason I covered such a large area was that I was interested in the V shaped potential bounce from the trendline marked in blue. My initial plan was a buy with the trend . However, as I watched price unfold I seen that most of the volume continued to be higher up. This gave a big clue that the major players were selling. As price came back to this area.
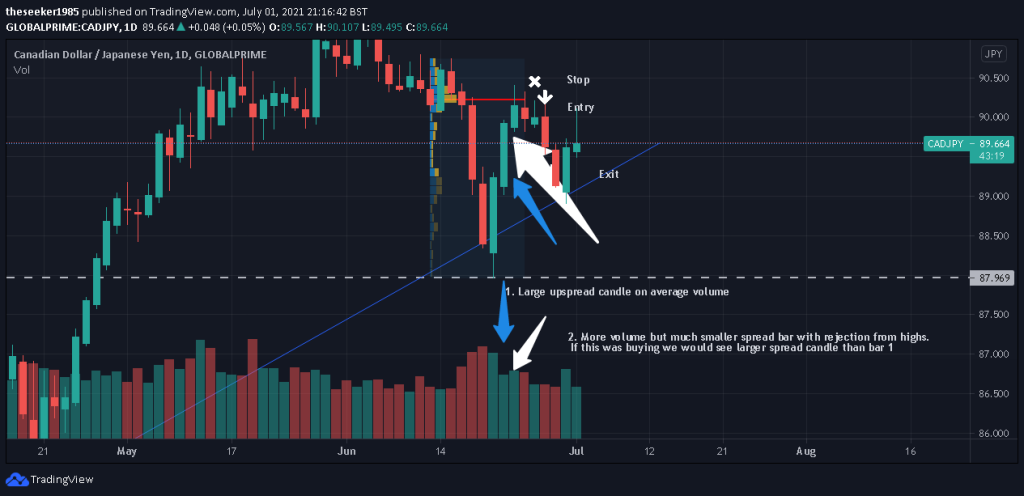
Another huge indication that we would be having some sort of a move lower were the candles on the way back up to the point of control.
I have labelled a chart below. At point 1 we seen a large up candle on average volume. This was then followed by a much smaller up candle with rejection at the highs ( from the point of control) as well as an increase in volume. An increase in volume would have created an even bigger up bar if this volume was buying.
This indicator, coupled with the point of control being at the highs and very little visible selling around the trendline was what gave me the confidence in this setup. My target was fairly conservative, at the next node of higher volume as indicated on the chart.

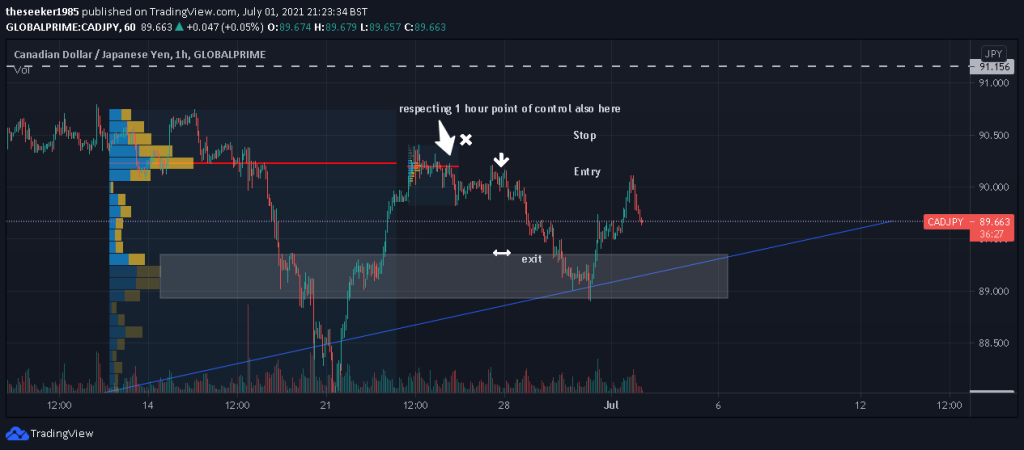
I have also added a one hour chart showing how there was a very similar pattern emerging on this timeframe. We see a fast move down and the most volume from that move down being shows at the high. As price then retests the area we see rejection from the point of control.
